
Estimate the speed of Windows 7 can be used using a special performance index. It displays a generalized estimate of the operating system by a special scale, producing measuring the configuration of equipment and software components. In Windows 7, this parameter is from 1.0 to 7.9. The higher the indicator, the better your computer will work more stable, which is very important when performing heavy and complex operations.
We estimate system performance
The overall assessment of your PC shows the smallest performance of the equipment in general, given the possibilities of individual elements. Analysis of the speed of the central processor (CPU), RAM (RAM), Winchester and Graphic Card, taking into account the days of 3D Graphics and Animation of the Desktop. You can see this information both with third-party software solutions and through standard Windows 7 features.
Method 2: CHRISPC WIN EXPERIENCE INDEX
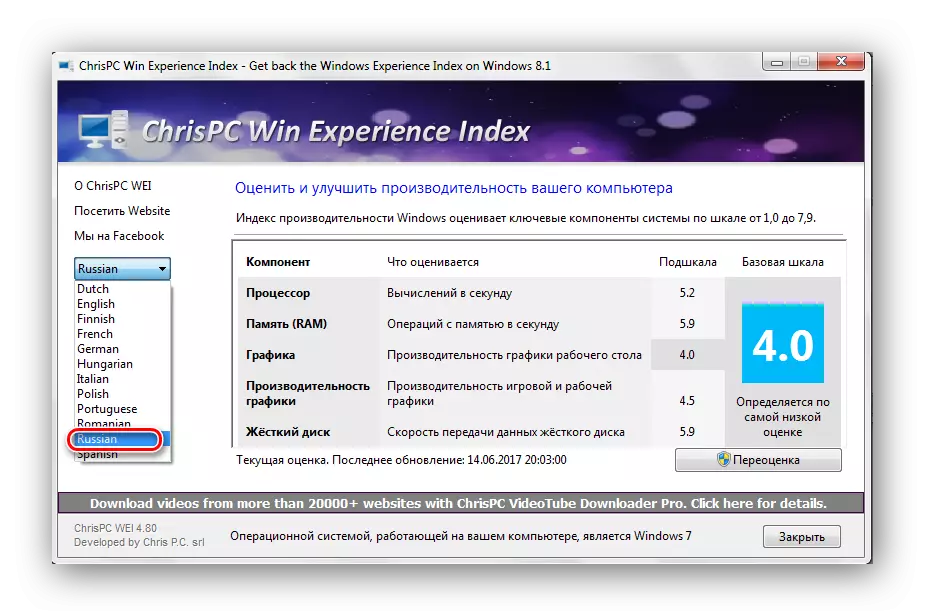
With the CHRISPC Win Experience Index software, you can see the performance index of any version of Windows.
Download ChrisPC Win Experience Index
We produce the simplest installation and run the program. You will see the system performance index by key components. Unlike the utility that was presented in the last method, there is an opportunity to establish Russian.
Method 3: Using the graphical interface of the OS
Now let's figure out how to go to the appropriate section of the system and monitor its productivity using the built-in OS tools.
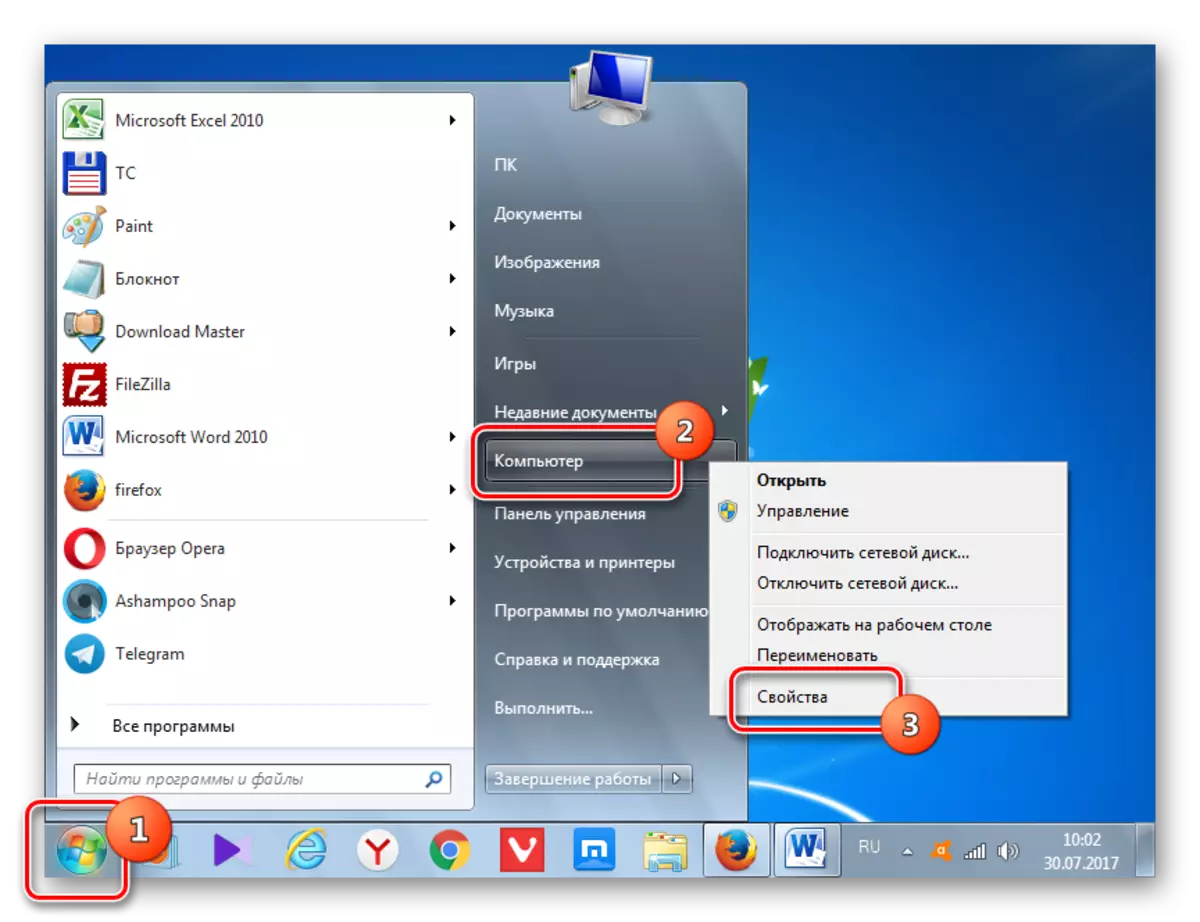
- Press "Start". Click the right mouse button (PCM) on the "Computer" item. In the menu that appears, select "Properties".
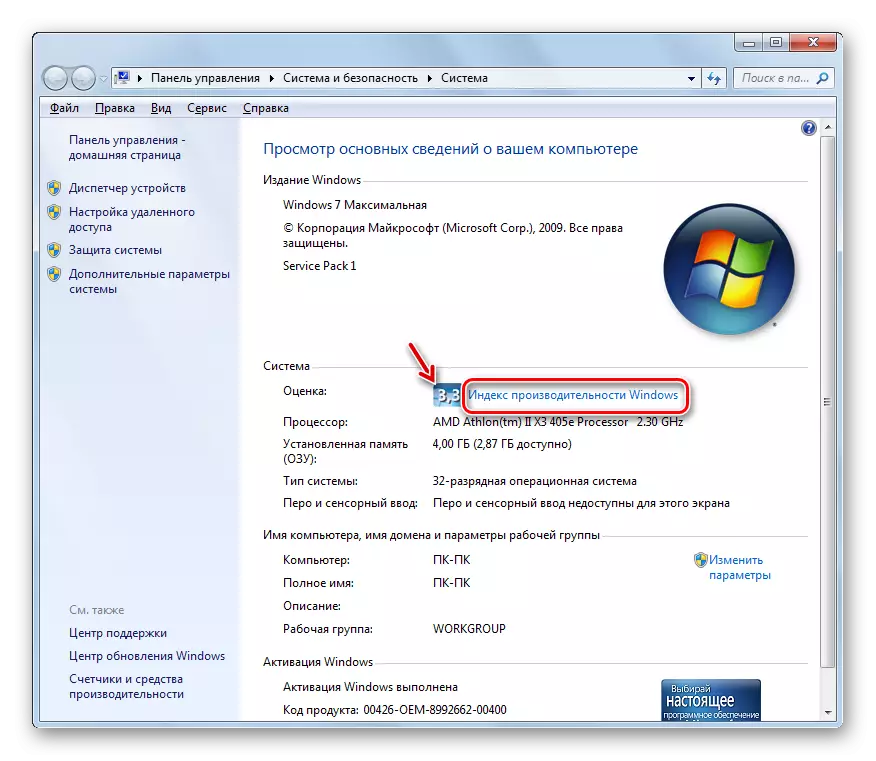
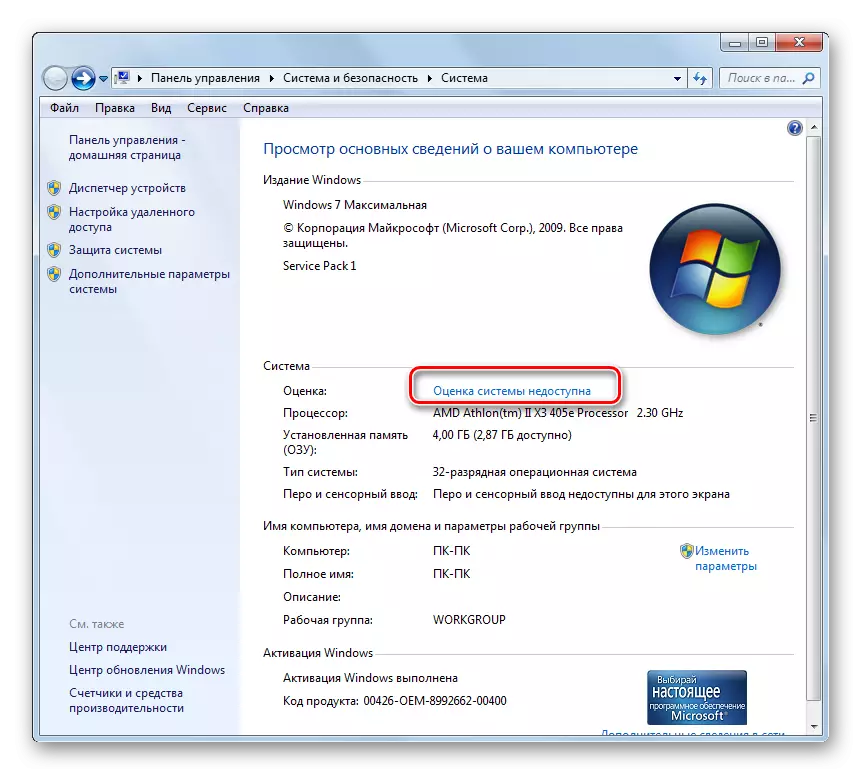
- The system properties window starts. In the "System" parameter block, there is an "score". It is he who corresponds to the general index of productivity, calculated by the smallest estimate of individual components. To view detailed information on the evaluation of each component, click on the "Windows performance index".
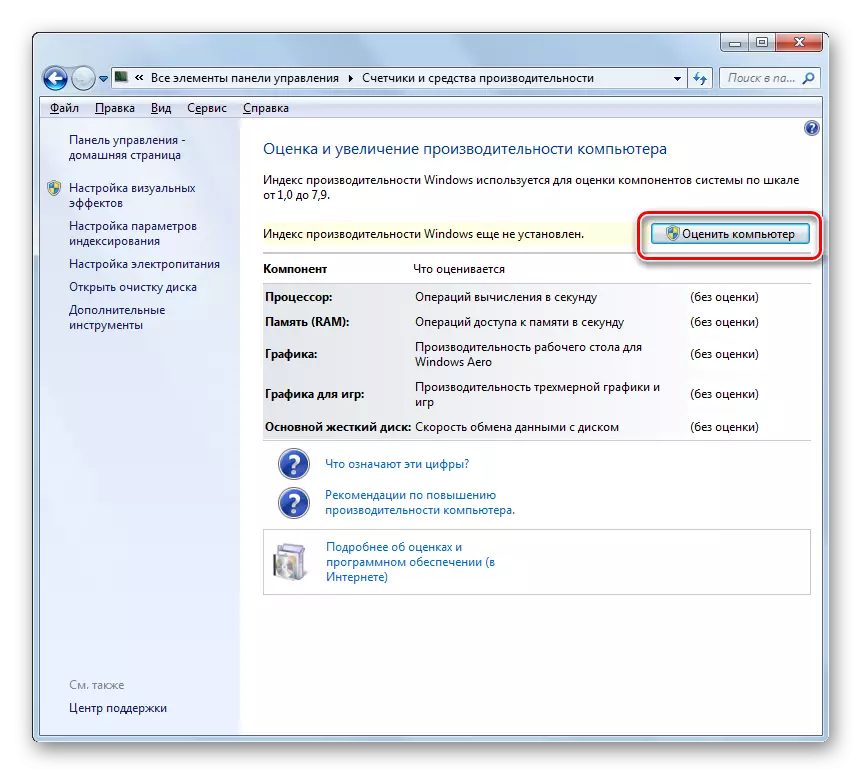
If the productivity monitoring on this computer has never been done before, then in this window the inscription "System Evaluation" will be displayed, according to which it is necessary to go.
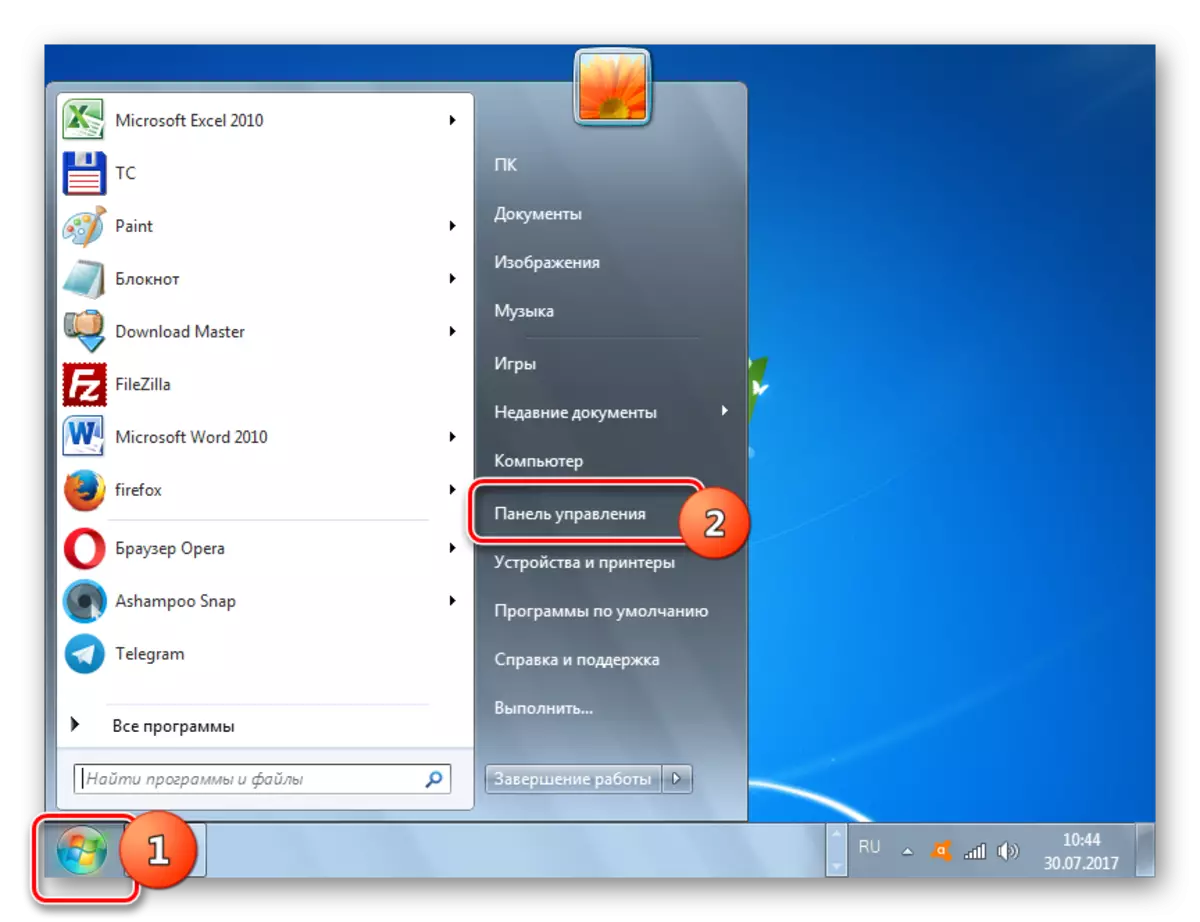
There is another option to go to this window. It is carried out through the "control panel". Click "Start" and go to the "Control Panel".
In the "Control Panel" window that opens, in front of the "View" parameter, set the "Minor Icons". Now click on "Counters and Productivity Means".
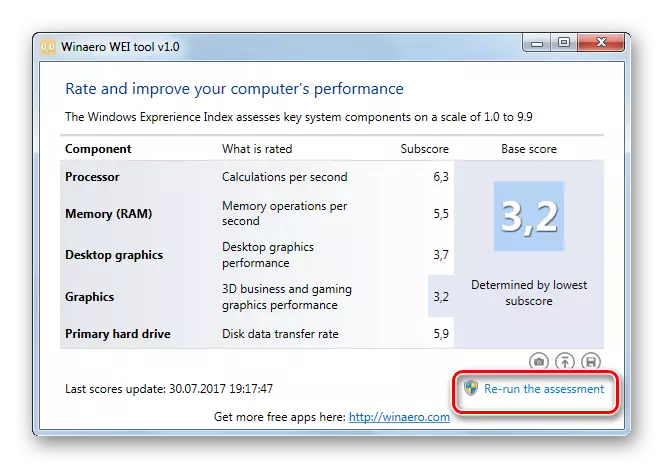
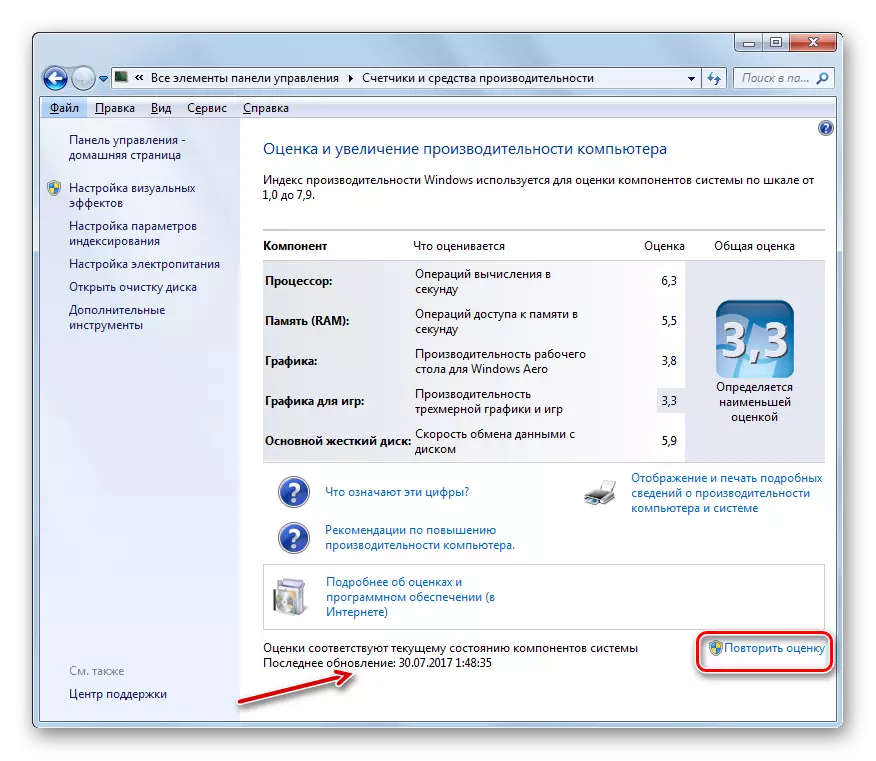
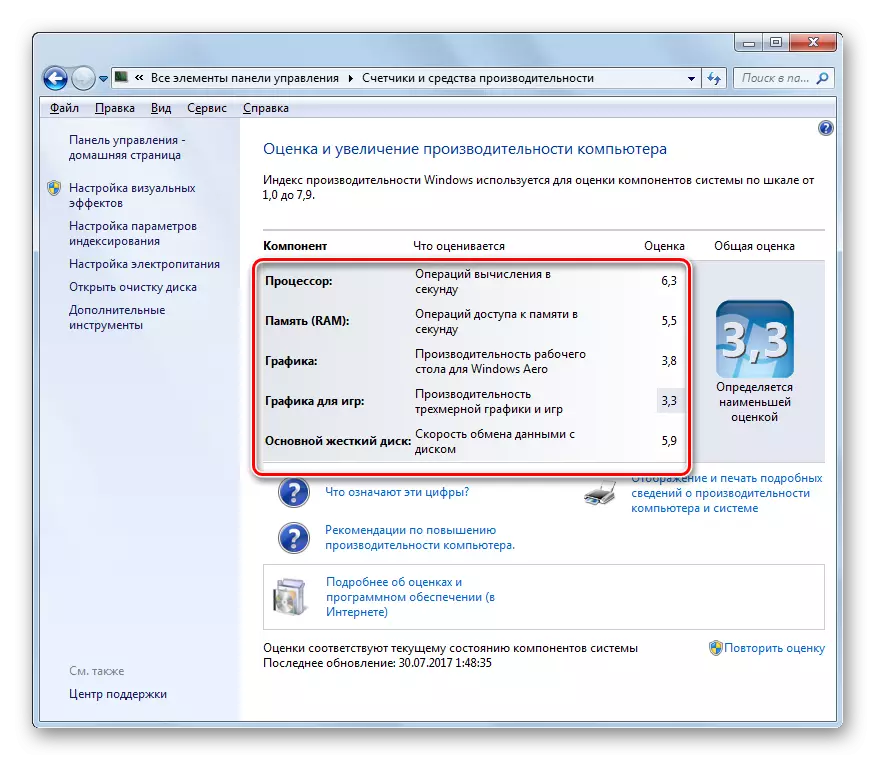
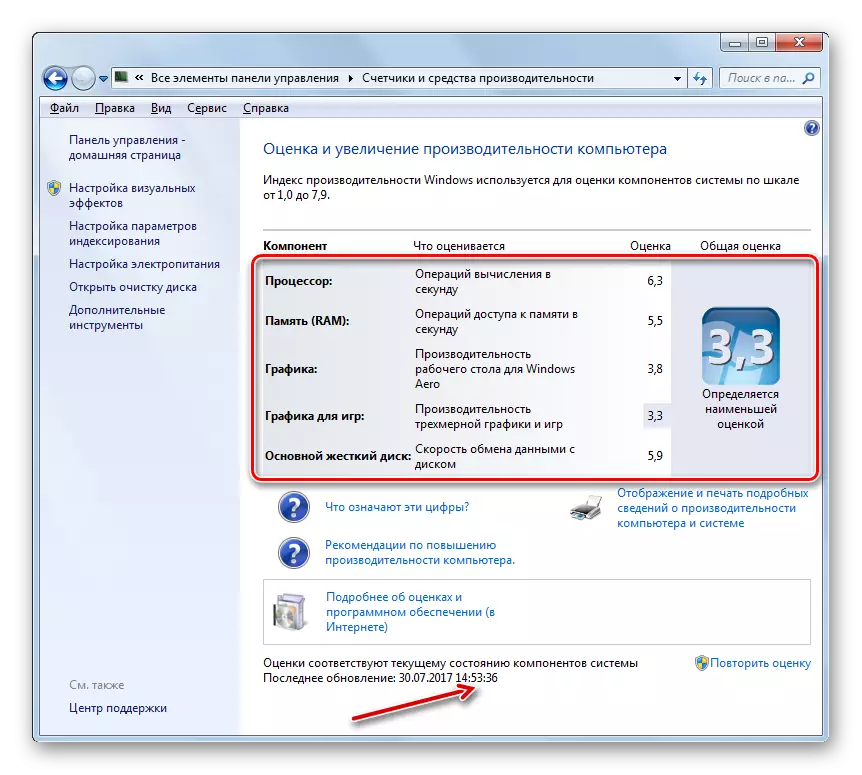
- The "Evaluation and Increase Computer Performance" window appears. It displays all estimated data on individual components of the system, which we have already spoken above.
- But over time, the performance index may vary. This may be due to both the upgrade of the computer hardware and the inclusion or disconnection of certain services through the system interface. At the bottom of the window opposite the "Last Update" item, the date and time when the last monitoring was performed. In order to update the data currently, click on the inscription "Repeat the rating".
If never before this monitoring was performed, then you should click on the "Rate Computer" button.
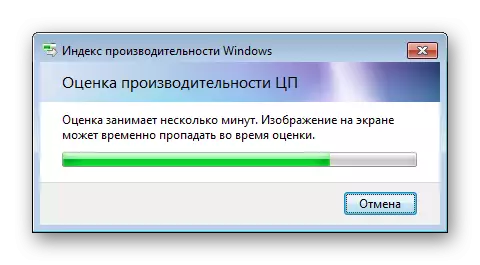
- Analysis tool is launched. The procedure for calculating the performance index, as a rule, takes a few minutes. During its passage, the monitor temporary disabling is possible. But do not be afraid, even until the check is complete, it will turn on automatically. Disconnection is associated with checking graphic components of the system. During this process, try not to perform any additional actions on the PC so that the analysis is as objective as possible.
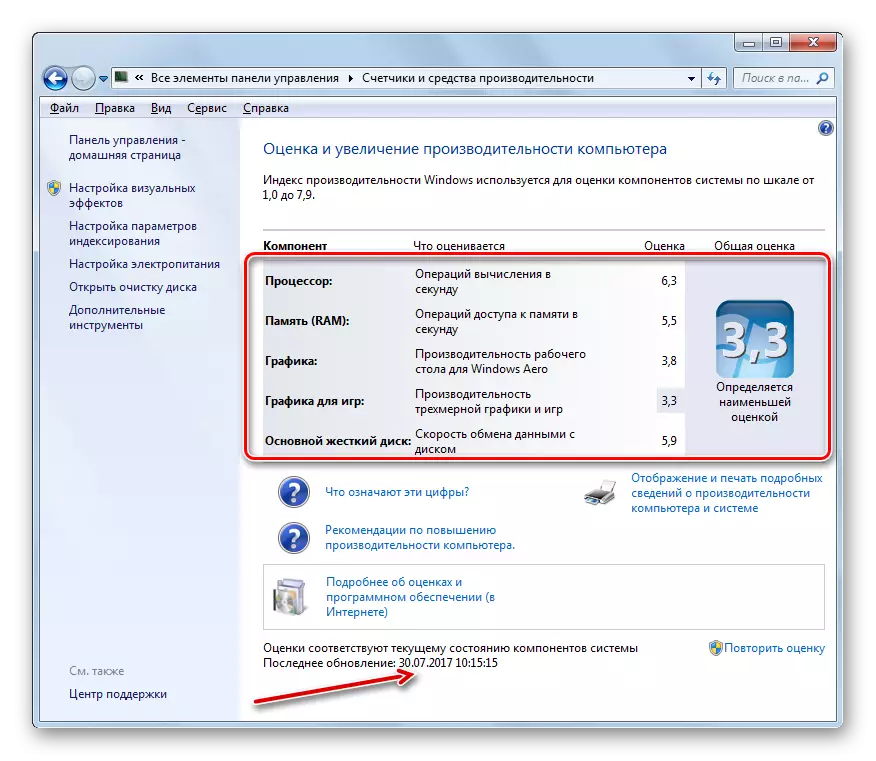
- After completion of the procedure, the performance index data will be updated. They can coincide with the values of the previous assessment, and may differ.

Method 4: Performing a procedure through the "Command Line"
Performing the calculation of the productivity of the system can also be launched through the "Command Line".
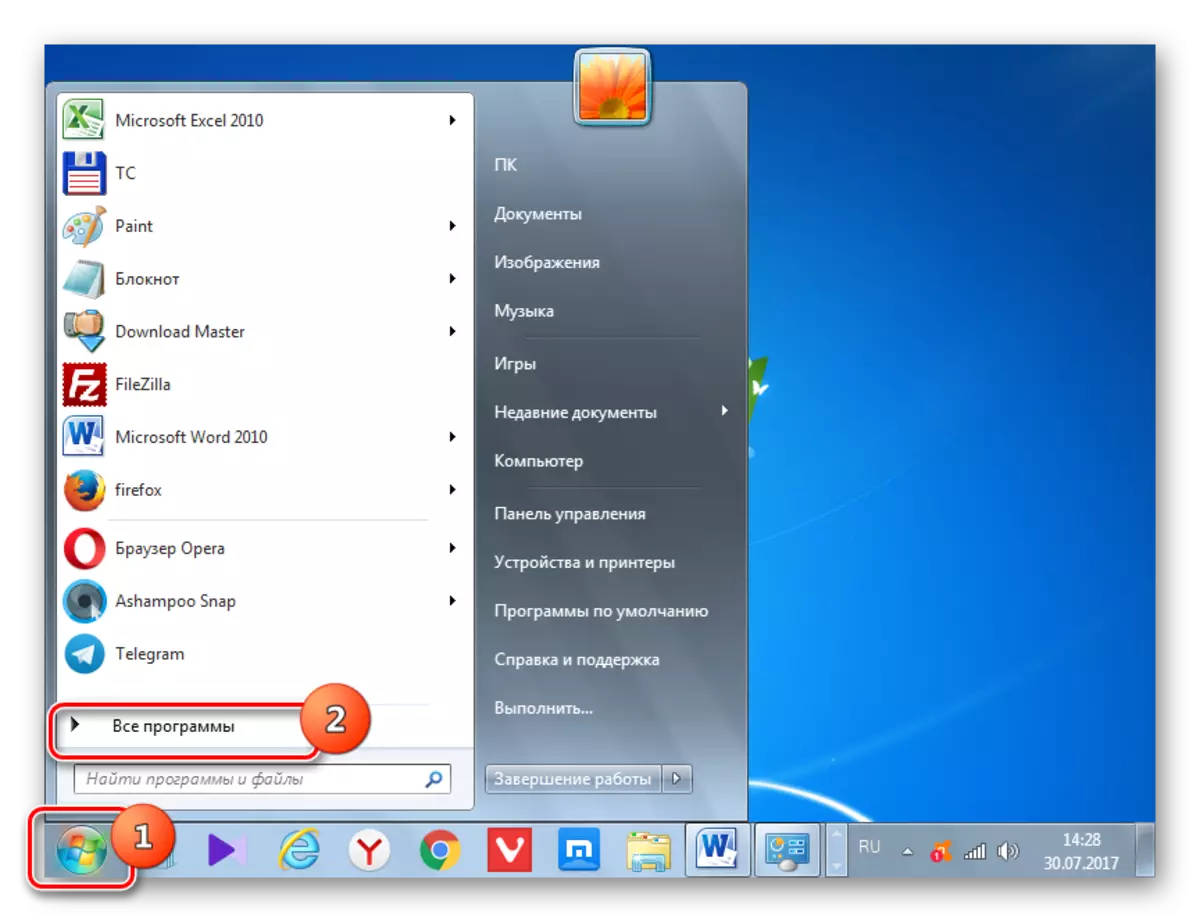
- Click "Start". Go to all programs.
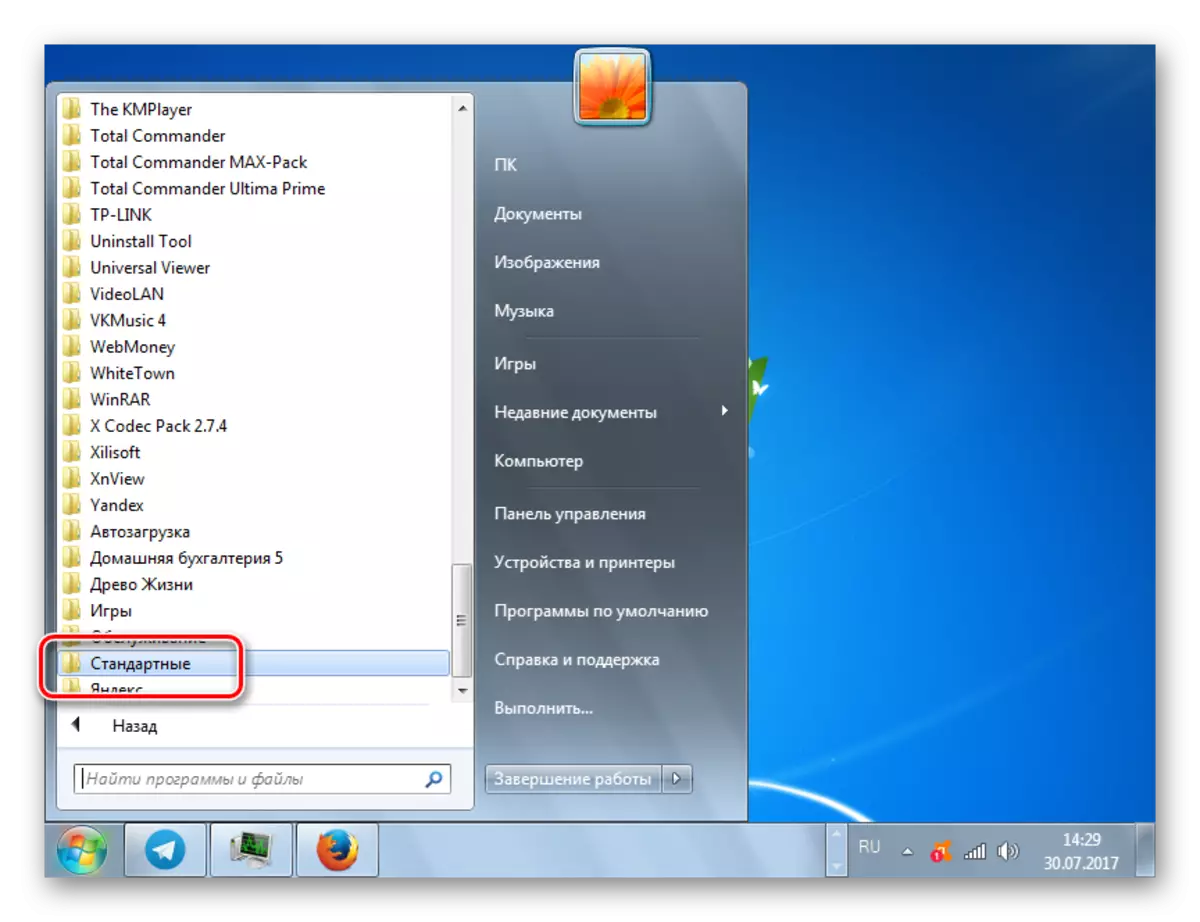
- Enter the "Standard" folder.
- Find the "Command Line" name in it and click on it by PCM. In the list, select "Run on behalf of the administrator." Opening a "command line" with administrative rights is a prerequisite for the correct execution of the test.
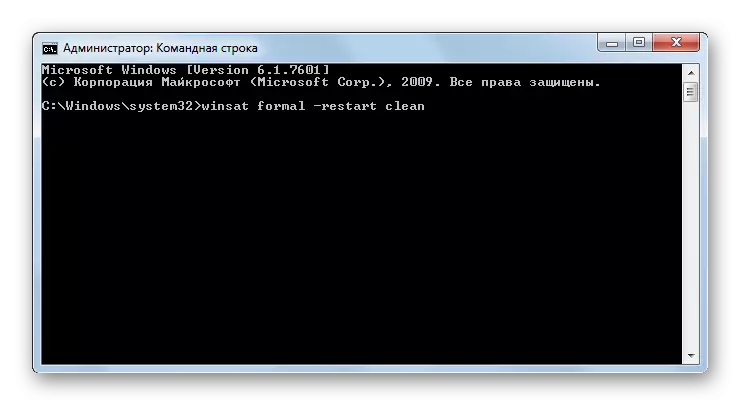
- From the person of the administrator, the "Command Line" interface is launched. Enter the following command:
WinSat Formal -restArt Clean
Click ENTER.
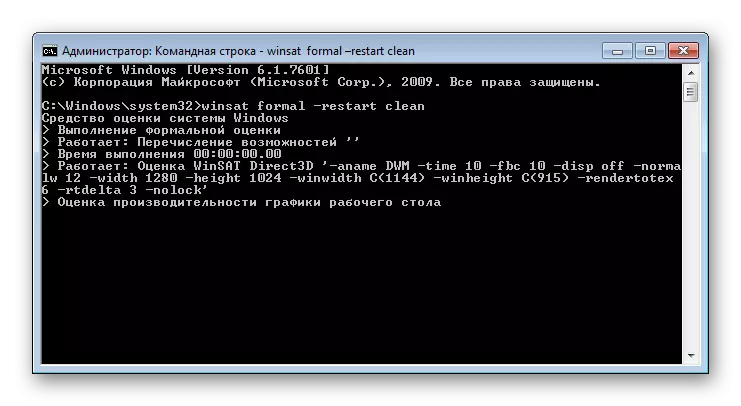
- The test procedure begins, during which, as well as when testing through the graphical interface, the screen may go over.
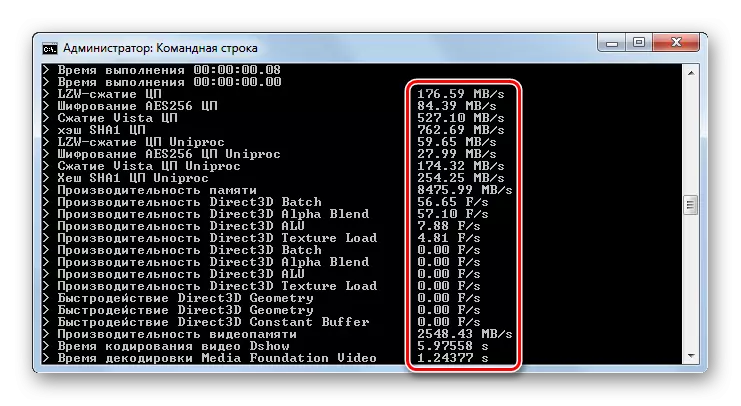
- After the end of the test in the "Command line", the total time of execution of the procedure will appear.
- But in the "Command Line" window you will not find productivity estimates that we have previously seen through the graphical interface. In order to see these indicators again, you will need to open the "Evaluation and Increase Computer Performance" window. As you can see, after performing the operation in the "Command line", the data in this window was updated.
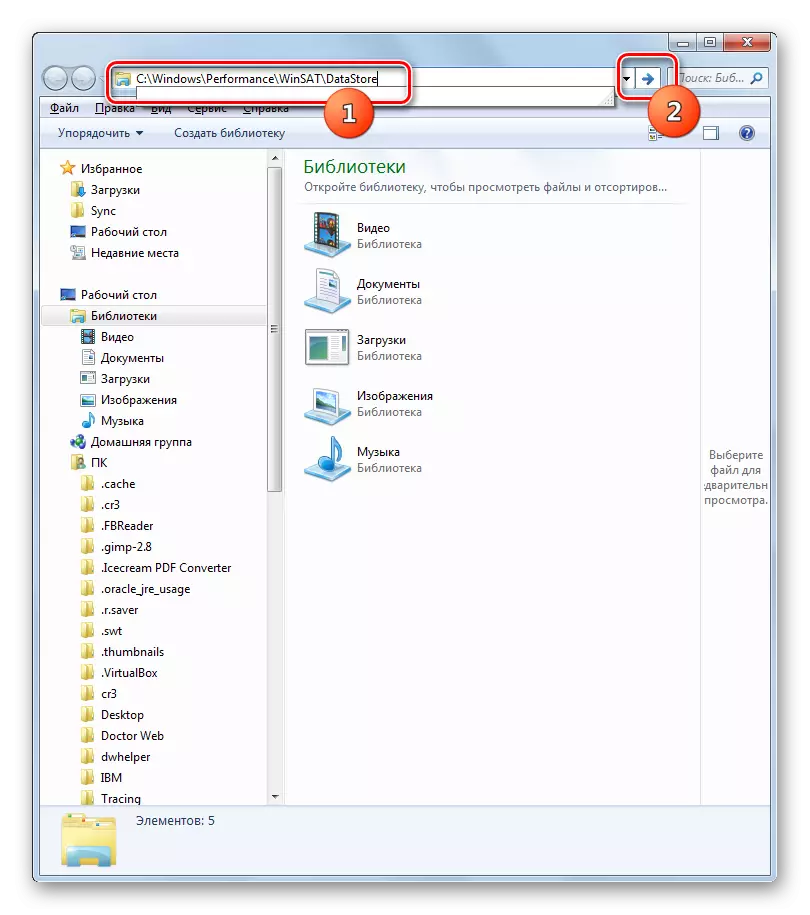
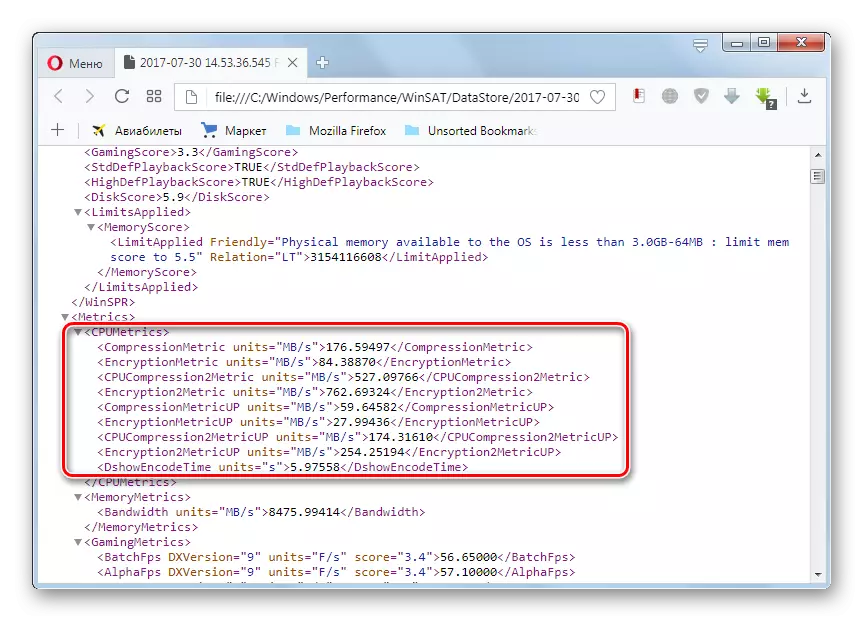
But you can see the result, at all without using the graphical interface for this. The fact is that the test results are recorded in a separate file. Therefore, after performing the test in the "Command line" you need to find this file and view its contents. This file is located in the folder at the following address:
C: \ Windows \ Performance \ Winsat \ Datastore
Enter this address to the address bar "Explorer", and then click on the button as an arrow to the right or press ENTER.
- A transition to the desired folder will be performed. Here it is necessary to find a file with an XML extension, whose name is compiled according to the following template: First, the date is first, then the formation time, and then the expression "Formal.assessment (Recent) .winsat". There may be several such files, since testing could be carried out more than once. Therefore, look for the latest in time. In order to make it easier to search, click on the "Date of Change" field setting all the files in order from the newest to older. Having found the desired element, click on it twice with the left mouse button.
- The contents of the selected file will be open in the default program on this computer to open XML format. Most likely, it will be some browser, but there may be a text editor. After the content is open, look for the WINSPR block. It should be located at the top of the page. It is in the specified block and the performance index data is concluded.
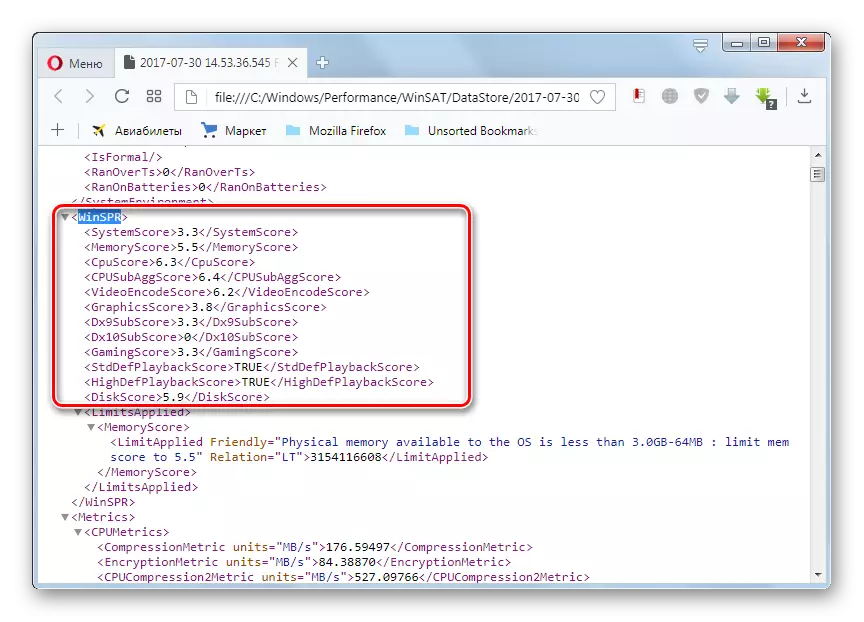
Now let's see what the tags presented are answered:
- SystemScore - basic evaluation;
- Cpuscore - CPU;
- Diskscore - Winchester;
- MemoryScore - RAM;
- GraphicsScore - general graphics;
- GamingScore - game graphics.
In addition, there is also an additional evaluation criteria that are not displayed through the graphical interface can be seen.
- CPUSUBAGGSCORE - additional processor parameter;
- VideoNcodescore - processing of coded video;
- Dx9subscore - parameter dx9;
- DX10SUBScore - parameter dx10.

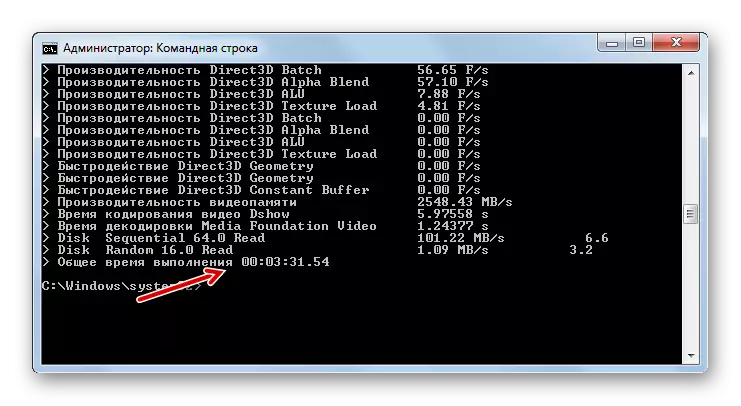

Thus, this method, albeit less convenient than obtaining an assessment through a graphical interface, but more informative. In addition, it is not only a relative performance index, but also absolute indicators of certain components in various units of measurement. For example, when testing a processor is a speed in MB / s.
In addition, absolute indicators can be observed directly during testing in the "Command Line".
Lesson: How to enable "Command Line" in Windows 7
That's all, it is possible to estimate the performance in Windows 7, both with third-party software solutions and using the built-in OS functional. The main thing is not to forget that the overall result is issued at the minimum value of the system component.