
Tableau Desktop.
Tableau Desktop is a software whose functionality is directed exclusively to creating graphs. Developers paid special attention to details and tools that are actively used in the development of global projects. Tableau Desktop does not have any restrictions on the type of graphs or the number of elements embedded there: you can combine different constructions, add any number of statistical data, indicate the locations and causes of specific steps. If the schedule is part of a presentation showing the company's growth or other indicators, insert the living slides, set the names for them and use to detail the view.

For advanced analytics, it will be necessary to create not just a panel with numbers, but a huge project. Tableau Desktop will allow you to quickly produce powerful calculations based on existing information, drag the checkpoints and watch statistical reports. This will help to create a point of view of statistical understanding through the analysis of trends, regressions and correlations. Specify new questions, define demand, opportunities and make decisions based on information, with confidence, because mathematical calculations in Tableau Desktop are always correct. The only two drawbacks of this for the paid distribution and lack of Russian, but from the official site you can download a demonstration version for free to get acquainted with Tableau Desktop and decide whether it should be purchased.
Download Tableau Desktop from the official site
Yed Graph Editor
YED Graph Editor is a powerful Windows software that can be used to quickly and efficiently create diagrams and graphs completely to different topics. Add projects manually or import external data for analysis - Automatic location built into the YED Graph EDITOR algorithms will create a completely correct display of each target element, and you will only be left slightly edit the finished document.

This software supports the import of its own data from the EXCEL e-table or XML, automatic ordering of the elements, export of raster and vector graphics in PNG, JPG, SVG, PDF, SWF format. Supports a wide YED Graph Editor Spectrum of graph types: BPMN, block diagram, family tree, semantic networks, social networks and UML. In addition, YED also supports organizational charts, intelligent cards, floating charts, element relationship diagrams and much more. You can learn the full list of YED Graph Editor features on the official website by clicking on the link below.
Download YED Graph Editor from the official site
Dia Diagram Editor
The next software, aimed at creating graphs, is called the Dia Diagram Editor and the functionality is slightly inferior to the two representatives described above. However, for some users it will be even a plus, because in this the process of forming a diagram or any other project will be simpler. In the screenshot below you see the division of the Dia Diagram Editor's work space into several areas. On the left above are the basic tools for controlling lines, dots and added objects, and below - the list of figures available to rice. Place all the shapes and lines in the field on the right, creating the necessary schedule.
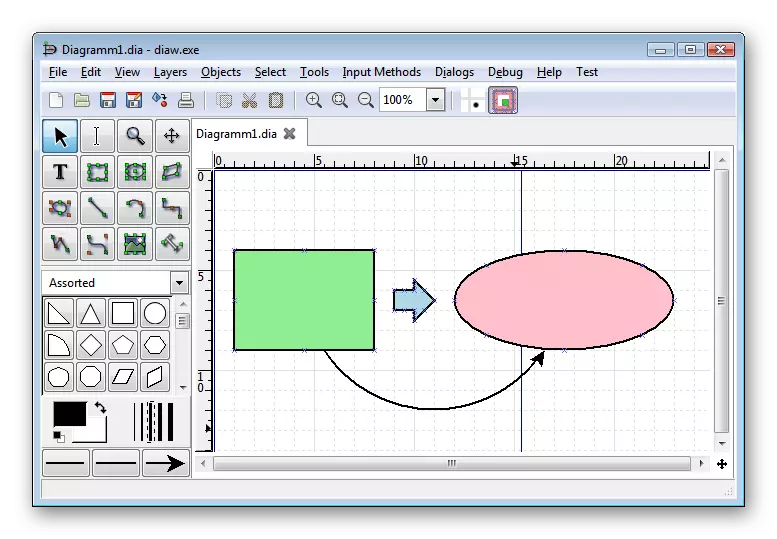
Dia Diagram Editor supports layers, so try when working with a project Create their competent distribution - this will help if you need to edit each object separately or create a group of elements, for example, to move them in a time or resize. There is no Russian language in this software, but the interface is very simple, so anyone can deal with it. With the rest of the principles of work with charts in the Dia Diagram Editor, we recommend reading yourself immediately after downloading and installing this free app.
Download Dia Diagram Editor from the official website
Microsoft Word.
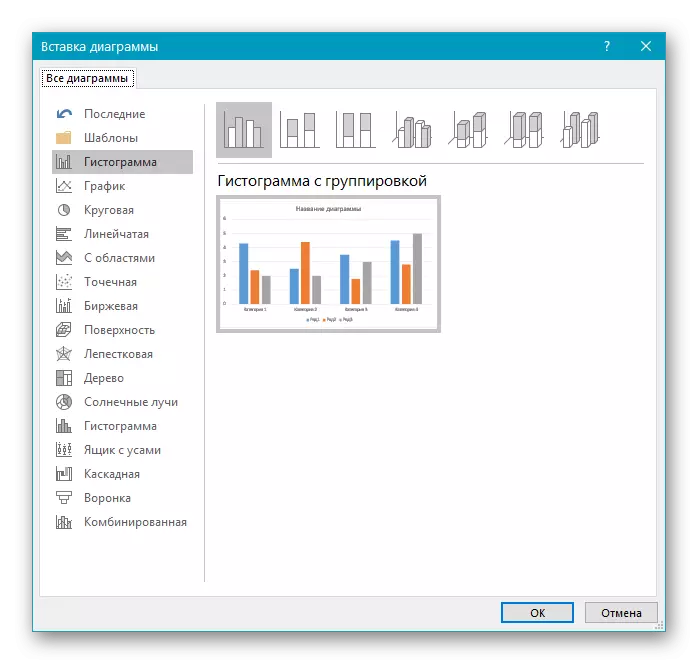
Microsoft Word is a well-known text editor, providing the user other than the ability to type text and other tools for making their documents. Among all those present in the Word Modules, we will discuss those who are responsible for creating diagrams and graphs. In the last assembly of software, there are entire sixteen different blanks for building various charts and graphs: for example, you can form a point view or build a tree by setting the source data.
Microsoft Word has different styles, and their manual change is also supported, which will help to make the appearance of the graph suitable for the general design of the document. The advantage of this software for creating graphs is that it is extremely easy to learn and is ideal for simple tasks and presentations, where in addition to the graph itself there is a block of text.
On our site you can read the material on the topic of creating graphs in Microsoft Word. In it you will find two methods of elements, as well as learn about the principles of editing the added graph or the diagram of any type.
Read more: How to create a diagram in Microsoft Word
Microsoft Excel.
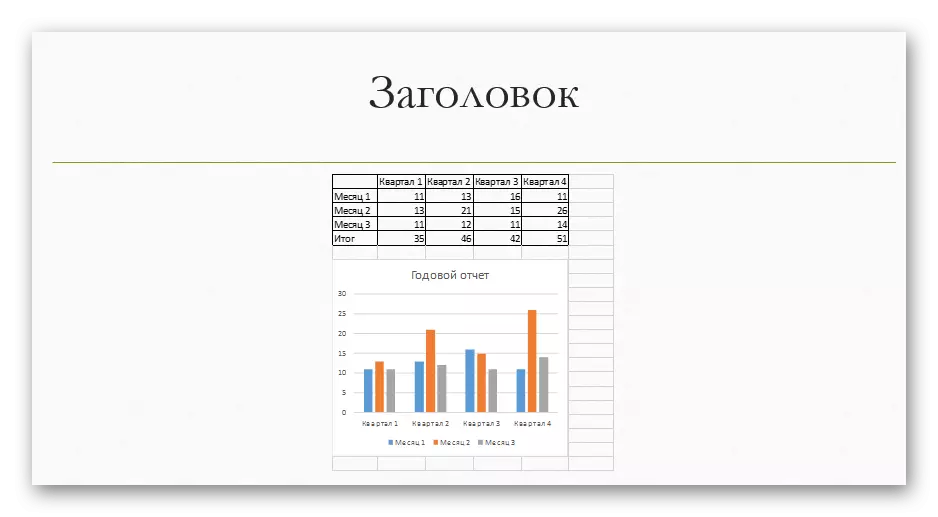
If the schedule needs to be built by means of a product of certain mathematical calculations or the introductory will constantly change, I will ideally cope with the task of Microsoft Excel. In it, you can build a chain of the introductory using the formulas, and then create a graph of them that will display the current results of these very data. For example, Microsoft Excel is ideal for visualizing sales or revenue growth.

Graphs in Excel are also different, but the most popular is the usual. You can add intersections, points, and only then additionally edit the diagram itself and engage in connecting cells. With this there will be aware of any user, attaching minimal efforts. It will be more difficult to make a schedule, only if the introductory is too large, because then it will be necessary to spend a little more time on filling the table.
By analogy with Microsoft Word, we want to offer the Guide to Create Charts in Excel. There you will find instructions for adding and editing a regular schedule, as well as other information about working with these elements.
Read more: Building a graph in Microsoft Excel
Microsoft PowerPoint.
PowerPoint is the third solution from Microsoft, suitable for building graphs. The main functional orientation of this tool is to create presentations, so if you need to make any demonstration, all its elements can be combined in this program. The insertion of the chart takes about the same principle as in Word, which also applies to the templates present. The PowerPoint standard option allows you to insert the already created schedule from the file, which also sometimes becomes useful during the interaction with software.
The main design of the schedule in PowerPoint is due to the built-in slide creation tools. You can use a variety of figures, writing texts, add music and animation if required. Such an approach will be as correct as possible in the comprehensive project development, when other elements are also present in addition to the graph.
For more detailed information about working with charts in Microsoft PowerPoint, refer to the extended management on our website on the link below.
Read more: Creating a diagram in PowerPoint
OpenOffice Writer.
If you want to use a text editor to create a graph, but Microsoft's solutions do not afford the OpenOffice Writer. This is a free analogue of a well-known Microsoft program, in which there are all the same functions, and the interaction with them occurs in about the same algorithm. In this, the set of templates is less, but there is a built-in cartridge wizard, with which the visualization is not only created, but the parameters for it are specified for it, the number of data and additional elements are added.

After a successful creation, the schedule can be placed in any area of the document and proceed to further interaction with it. OpenOffice Writer has other auxiliary tools that allow you to change the appearance of the document, add comments, images and other objects. To do this, you only have to deal with a simple interface, whose items are completely translated into Russian.
For the detailed guidance on the rules for creating graphs and charts in OpenOffice, we offer to go to the article from another our author at the following link.
Read more: Building charts in OpenOffice Writer