
Adobe Illustrator
The functionality of the first software called Adobe Illustrator is not entirely intended to create various social projects, including the construction of infographics, since the stop here is made on the vector graphics. However, thanks to the tools present, you can create the required number of objects, it is beautifully issued to the page and impose text. It is recommended for using all user users who wish to create such presentations at a serious level, applying professional decisions. If you start with the demonstration free version of Adobe Illustrator, which is distributed for a period of 30 days, you can master all the functions present and understand how they correctly use to create the desired project.
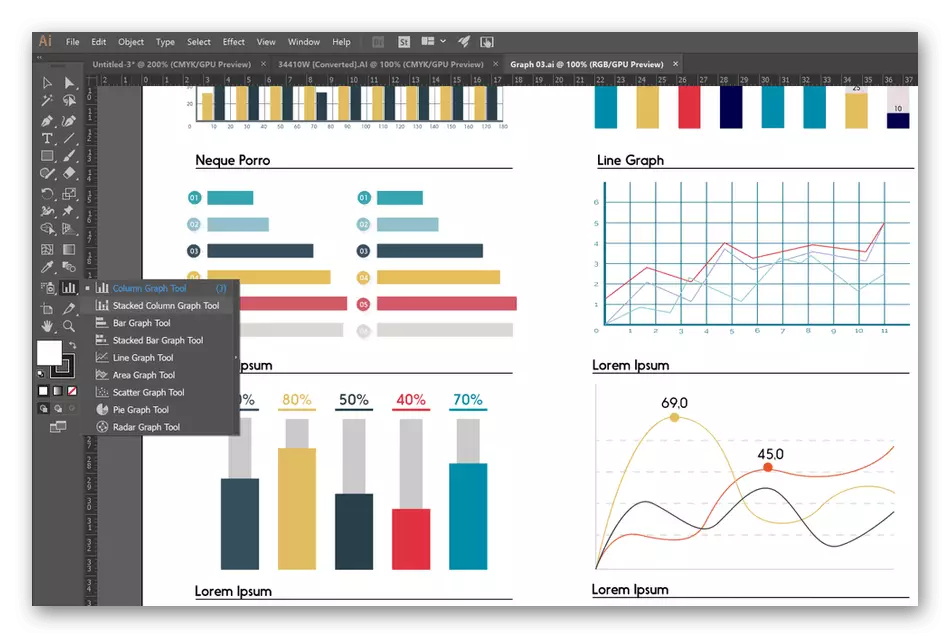
At first it may seem that Adobe Illustrator corresponds to the standard graphic editor. In part, it is so, because nobody canceled generally accepted functions and they need to be able to use, but there are many and unique tools designed to work with lines and points. It may seem that it will be very difficult to get comfortable in Adobe Illustrator, but there will be official prompts from developers and a huge number of simple, understandable video and text materials on this topic. We offer to read the link in more detail with this program below.
EDraw infographic
From the name of the edraw infographic program, it is already clear that it was specially designed to create infographics. To do this, all the necessary tools and a helper aimed at accelerating and optimizing the workflow have been added to it. From the very beginning, in the main menu, you choose the type of infographic for use by searching for a suitable template added empty. After that, add your elements or use objects embedded in EDRAW infographic, apply text, pay time and export a project to one of the appropriate file formats.
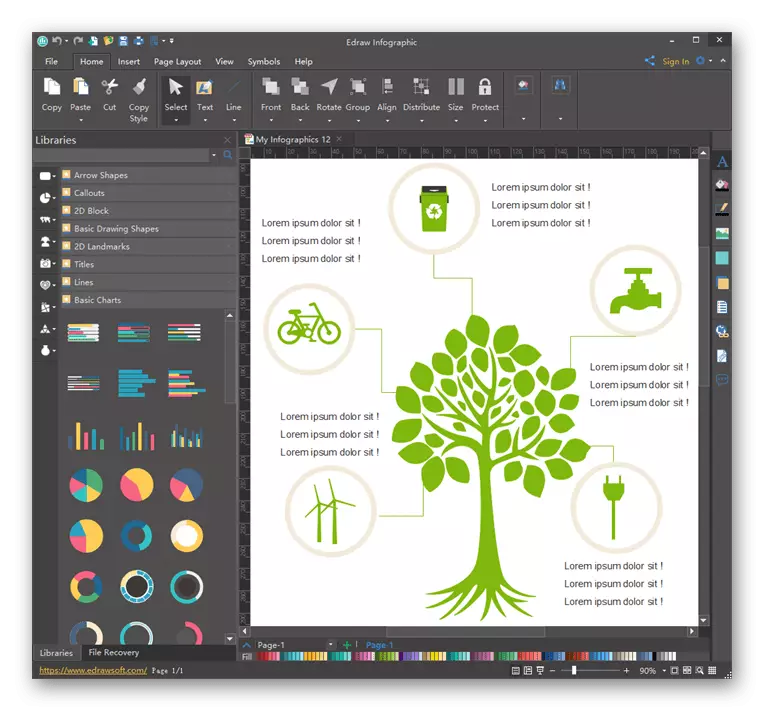
Thanks to the EDRAW Infographic functions, it is possible to implement posters of a variety of subjects, create a chart, a business card brochure or a banner. All this is carried out using the correct distribution and customization of the built-in elements. The presence of the import function will help to place ready-made objects, scaling them and choosing the optimal location in the workspace. EDRAW Infographic developers on the official website are offered to download software on a computer and familiarize yourself with the examples of work.
Download edraw infographic from the official site
Adobe Indesign
The Adobe InDesign software was designed to provide users with a convenient set of tools and functions designed to create pages of various directions and formats. It can be magazines, banners, leaflets, ads and even infographics. The easiest way to work with Adobe Indesign, when there is already a set of pictures necessary for use. You can only arrange a page using branded capabilities, add beautiful text and import items.
If you have previously encountered work in Adobe applications, it will be easy to understand this, because it will only have to familiarize yourself with unique tools related to text markup and other parameters. Just interacting with the text in Adobe Indesign paid special attention, since many projects and are based on different inscriptions and descriptions. You can download your own fonts, use formatting to create readable blocks, put the text over other parts and give it an unusual appearance. The Adobe Indesign is also distributed, since it is aimed at professional work. If you decide to try this software, first download its trial version to understand whether it is worth purchasing it.
Affinity Designer.
Affinity Designer is an advanced software for drawing, in which the raster and vector graphics are combined. Just thanks to the ability to implement projects in the Affinity Designer vector graphics and got into our review list, because most infographics are made precisely from such elements. In this decision you will find both standard tools related to the design of points, lines, adding various objects, import elements, and be able to open up new features that allow you to create an individual design of each project.
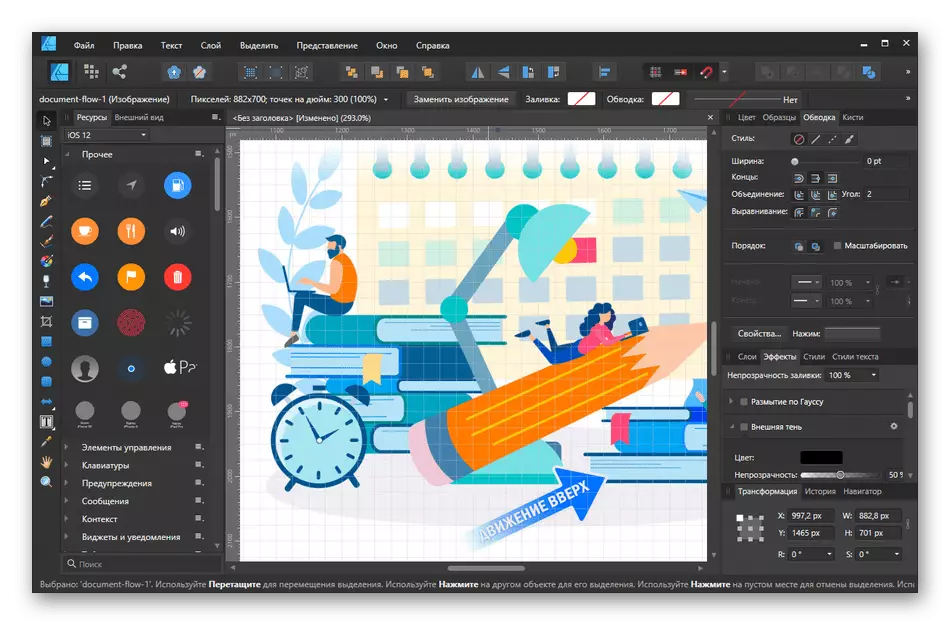
Nothing interferes at any time to switch between projects and independently make sketches, which in the future can be placed on infographics. Note that Affinity Designer will suit not by all users, because those who are looking for a simple software, directed solely on the creation of the type of type under consideration, will seem unnecessary all these professional brushes and options intended for raster drawing. However, if you are considering different options for designing your own work and you wish each of them to do unique, pay attention to this software exactly.
Download Affinity Designer from the official site
Krita.
Krita functionality is aimed at implementing various drawing stylistics, including allows you to create vector graphics, working exclusively with lines and dots. Due to this, the creation of infographics in this software is a completely executable process, and the project itself can be diluted with unique pictures drawn by all the same built-in tools. If you pay attention to the screenshot, then notice that in the appearance of Krita is similar to other solutions, which is reflected in the tools, most of which correspond to the usual, but with certain copyright nuances.
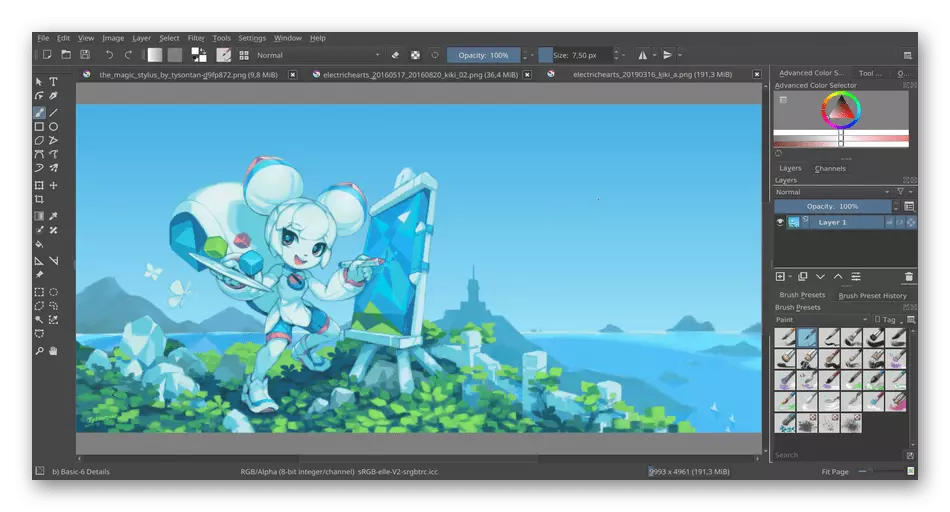
Krita supports PSD file format, which means that all composite projects that were previously created in the well-known Photoshop program can be easily imported and continuing editing without any changes directly when moving. Only because of this in Krita, the rapid collection of infographics from pre-created templates is available, where the individual elements are then added, for which the download and installation of this software occurred.
Download krita from the official site
Adobe Photoshop.
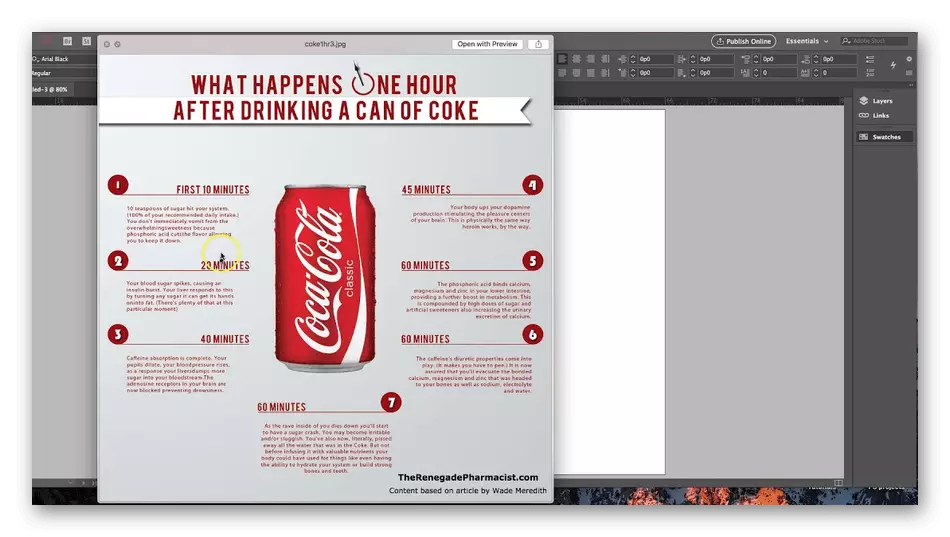
We just mentioned the software Adobe Photoshop, so it simply should not be noted that it is suitable for creating infographics, because it can be safely called a universal graphic editor. In Photoshop, many not only handle photos, but also make designs, advertisements, create logos and look the appearance of sites. The tools present in it are quite enough to develop a unique and beautiful project. An example of finished work implemented exclusively in Adobe Photoshop, you see in the image below.
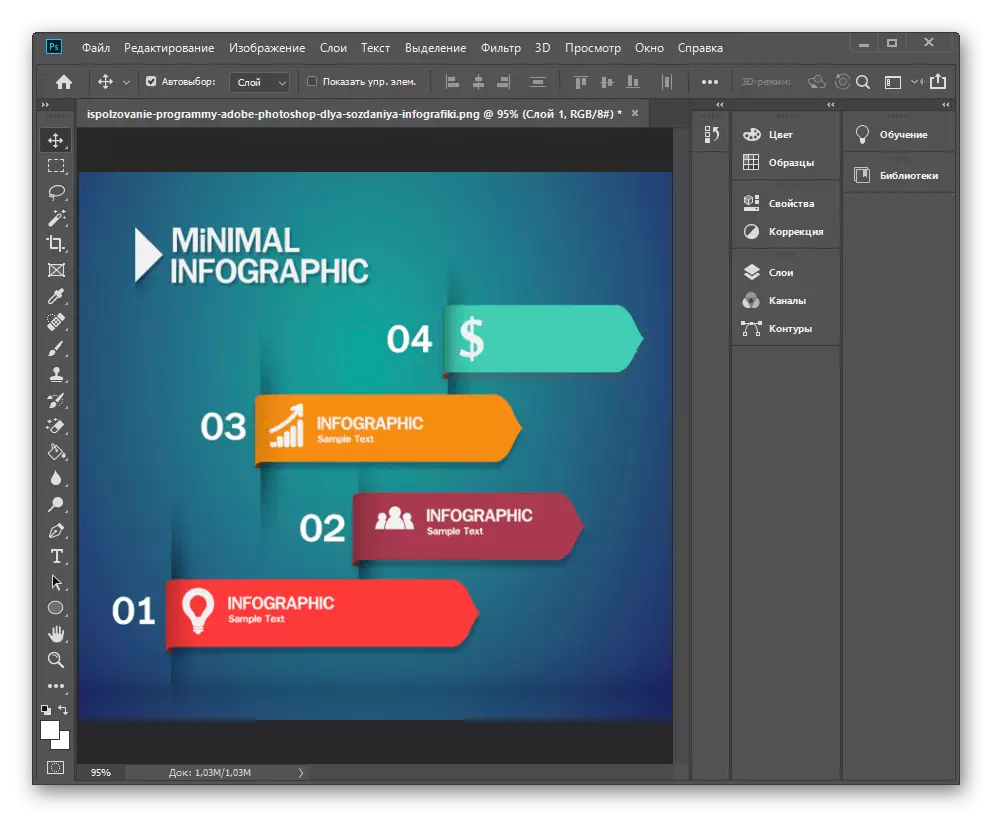
This option will be useful for those who have already installed it on a computer or previously used, because it does not have to understand the interface and features. However, to see or read several specialized lessons still worth it, because the creation of the right infographics depends on many factors and the correctness of the construction of elements, which depends on the author, and not automatically automatically.
Microsoft PowerPoint.
Completes the software list to create Microsoft PowerPoint infographics. The application is aimed at creating presentations, but its capabilities will be enough in order to implement projects that are in question in our review. However, it is worth noting that in PowerPoint you will not find many tools inherent in graphic editors, since the initial goal of the software was to meet the needs of a little different plan.
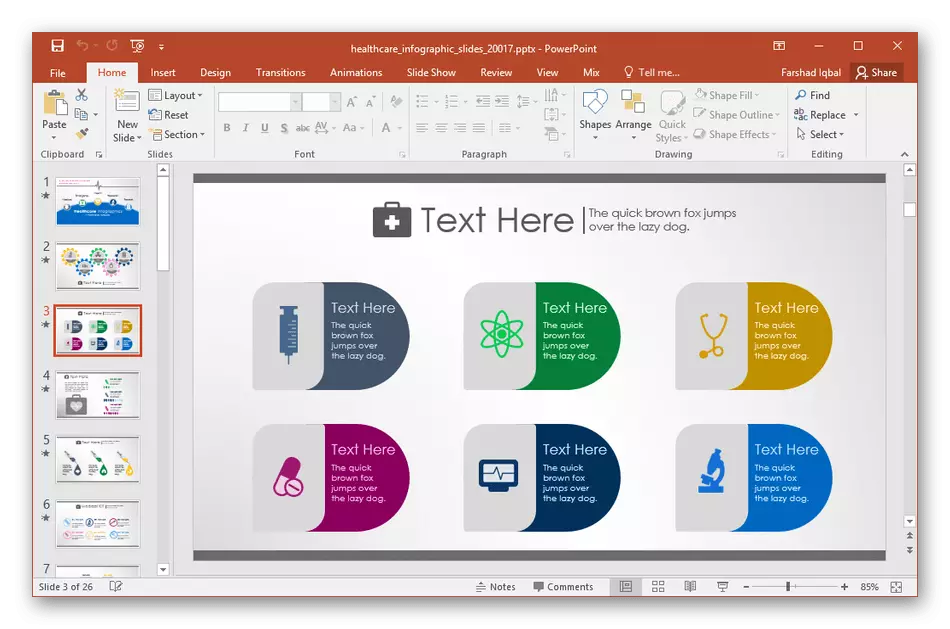
However, if you have already had to work at Microsoft PowerPoint, and the ideograph of infographics is not a complex and requiring drawing of individual elements manually, it will not hurt anything to use this application, quickly building quality work. At the same time, it can be placed even into several slides, add music or animated objects to create a full-fledged presentation from simple infographics, which will be demonstrated to the target audience.