Method 1: Electronic Tables
There are special-purpose programs aimed at working with spreadsheets. Usually, their functionality includes diagrams drawing tools according to a given range of data, which is initially entered into the table or is created with the object. We will consider this method on the example of two popular software representatives for working with spreadsheets.Microsoft Excel.
Anyone who at least several times came across a solution to various office tasks on the computer, I have accurately heard about the existence of Microsoft Excel. This is a well-known program that allows to engage in accounting and other types of accounts using spreadsheets, but can be useful for other purposes. Creating a diagram of any type, including circular, in Excel - the case is simple and will take literally a couple of minutes. This tells another our author in the article on the link below.
Read more: Charts in Microsoft Excel

OpenOffice Calc.
If the above option does not suit you because of paid distribution, we recommend paying attention to the free analog called Calc from OpenOffice. This is a component of a package of office programs, which is designed to work with spreadsheets and has all the necessary functions, useful and when creating a circular diagram. Let's analyze in more detail how this operation is executed in OpenOffice Calc.
- Run OpenOffice and select a module for the "spreadsheet" operation.
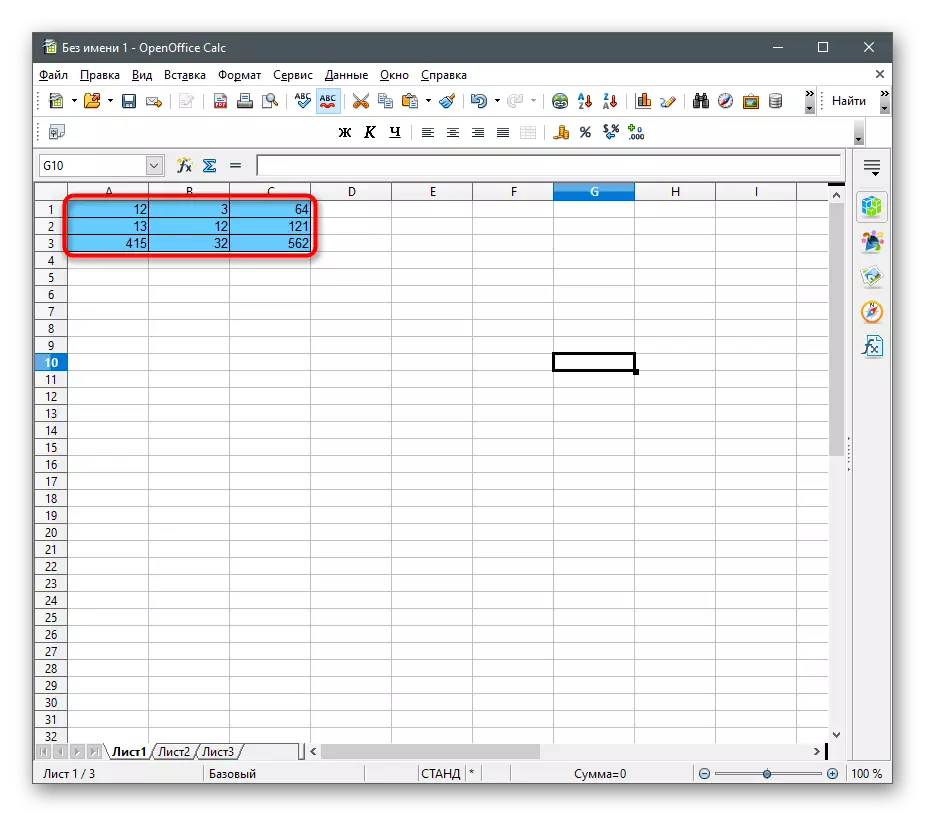
- To begin with, create a range of data around which the circular chart will be built, or import it into cells if the table has already been created.
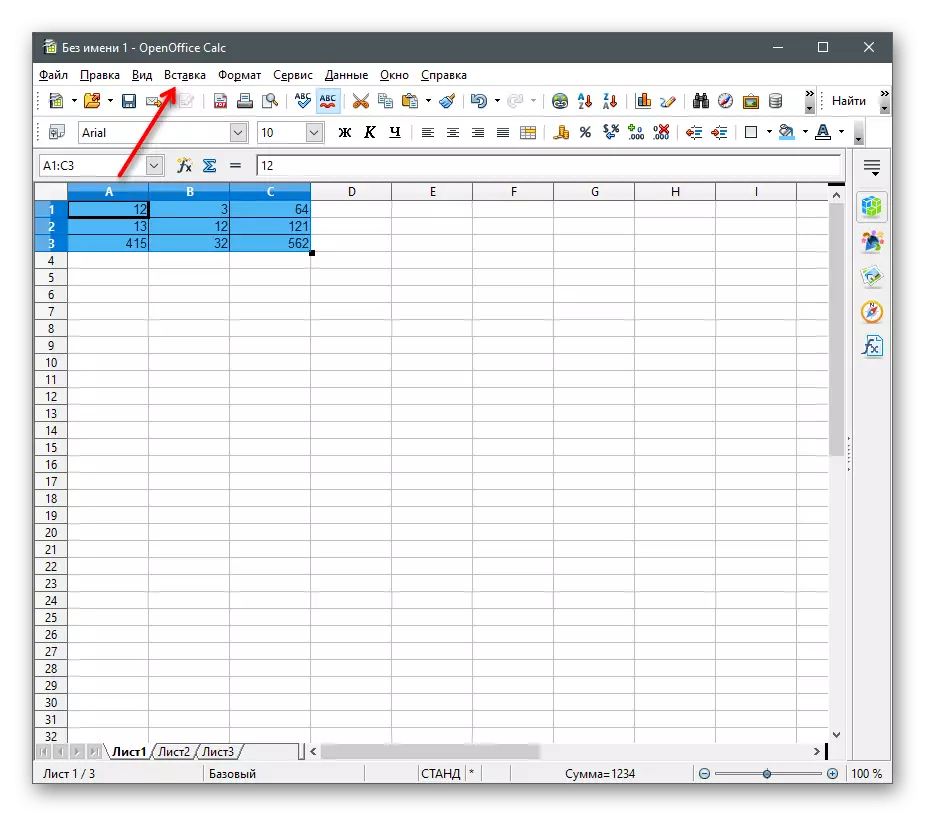
- Highlight it all and open the "Insert" menu.
- In it, select "Diagram".
- Find the "Select Diagram Type" block and specify the "Circular" option.
- Pay attention to its varieties presented in the number of four pieces. After determining the appropriate, click on "Next".
- If the data range is not specified (the table did not stand out as it was shown above), it will be necessary to choose it now by creating the appropriate cells.
- Take care that all those present or only the necessary number of data are included in the diagram, then complete the creation by clicking on "ready."
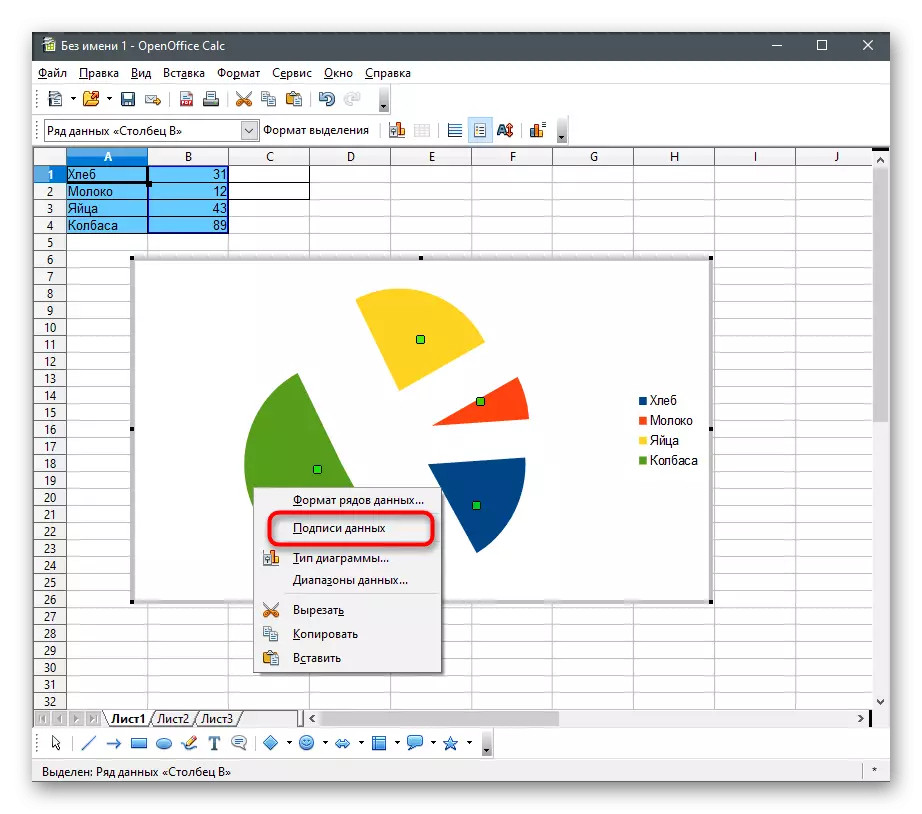
- Check out the result and activate the "data signatures" by calling the context menu by the right click on the diagram. This will display the number assigned to the cell opposite each block.
- In the next screenshot you see an example of how you can build a circular diagram in OpenOffice Calc in a non-standard view.
- Once work with the table is completed, save it in a convenient format and close the program.


In the last method of the article, we will talk again about the means to create spreadsheets, but it will be free online services. If you prefer their programs, we recommend reading these instructions.
Method 2: Text Editors
If you initially work with text formats of files, and not with tables, use the previous type of programs is simply meaningless, especially considering the availability of suitable functions in popular text editors. Next, you yourself will be able to make sure that the same Word or OpenOffice Writer can be safely used to add circular charts to sheets and embed them into a document with text.Microsoft Word.
The most popular text editor is Microsoft Word. It is installed on computers of multiple users and is actively used when working with various documentation. It is proposed to consider it as one of the means of integrating a circular chart into text. To do this, the Special "Designer" module is allocated in the software, which allows you to make the necessary editing. Click on the following header to proceed to reading the article on this topic.
Read more: How to create a diagram in Microsoft Word

OpenOffice Writer.
As the last time, we will tell about the free alternative in the form of OpenOffice Writer, which can also be used to build a circular chart with its further integration into a text document. Consider a step-by-step view of how it happens:
- After starting the main menu OpenOffice, select the "Text Document" option or open the existing for further editing.
- Expand the "Insert" menu and on the Mouse over the object to "object" and select "Diagram".
- By default, a columnar chart is created, so it will be necessary to change its type. To do this, right-click on it and from the context menu, select "Type of Chart".
- In the diagram type selection window that appears, find the "circular" and click on the left mouse button.
- To the right you will see available varieties of a circular chart, among which you can choose the appropriate.
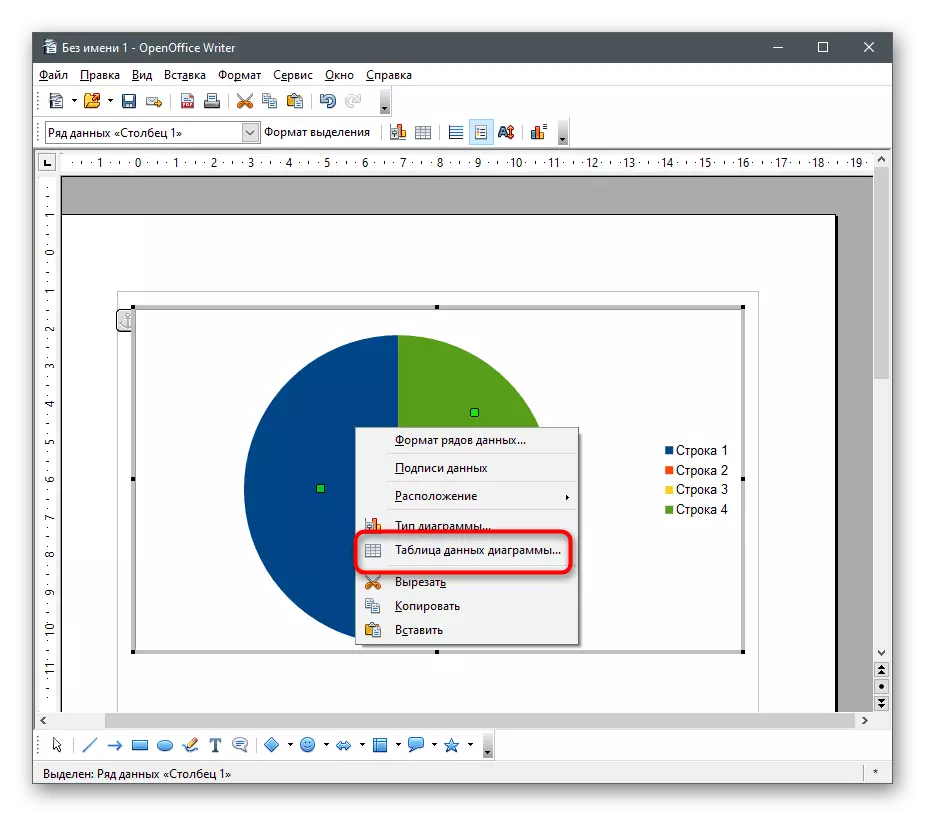
- Take into account that while the data range is not specified, so after adding an object, click on the PCM on it and select "Table Data Chart".
- A "Data Table" window appears in which you can create an unlimited number of rows and assign the corresponding values to them.
- Make sure that all data is displayed correctly, and only then save the changes.


Method 3: Presentations
The circular chart can be part of the presentation, so it must be inserted at the stage of editing. You can do this with the help of the same programs where work with slides is carried out. By tradition, we will analyze two options: a paid and free alternative, and you can pick up suitable for yourself.Microsoft PowerPoint.
Microsoft's PowerPoint product is widely used to create presentations of the most different level. Of course, sometimes users need to implement a diagram or other elements associated with the tables, so the developers have provided appropriate functions that can help cope with this task. Details on how to create a chart in this program, read the article on the link below.
Read more: Creating a diagram in PowerPoint

OpenOffice IMPRESS.
OpenOffice software holders can use a component called Impress, which is not only ideal for working with presentations, but also allows you to insert a diagram in them, including a circular one.
- Run the program and in the start menu, select the "Presentation" option.
- Create an empty presentation, use templates prepared by developers or import an existing project.
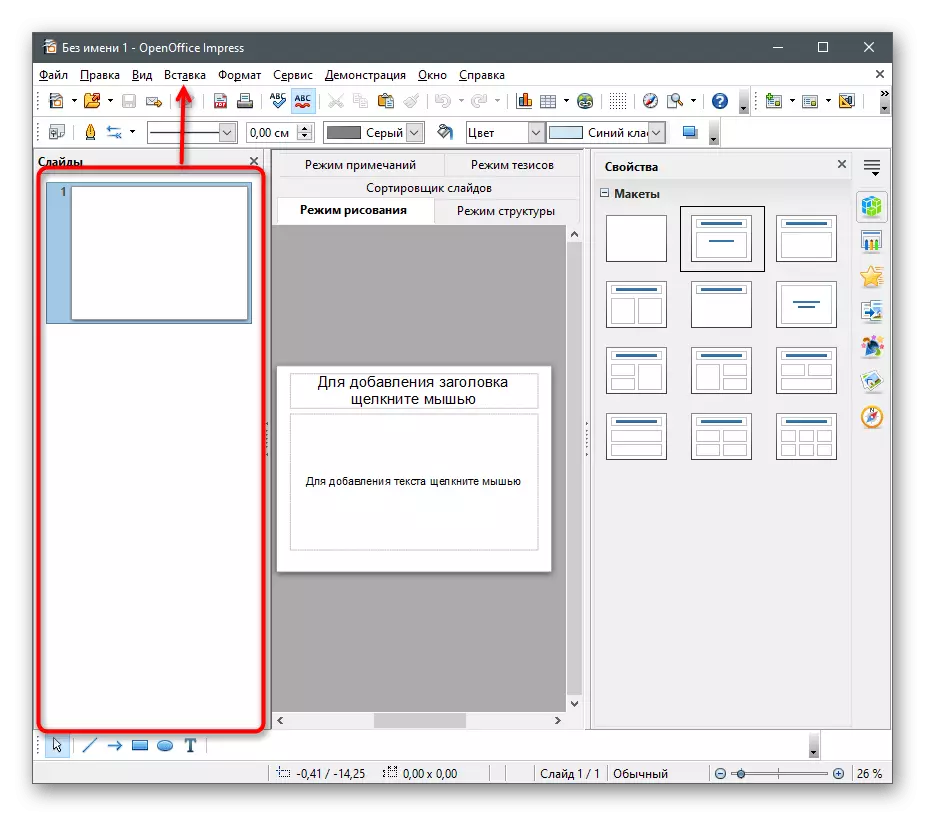
- Select a slide in advance where you want to insert a circular chart, and open the "Insert" menu.
- In it, find the item "Diagram" and click the left mouse button.
- The diagram is automatically added to the current slide, and you can move it or resize using the transformation points along the edges.
- So far, the diagram has no data range, so it does not show useful information. To correct this situation, click on it PCM and from the context menu, select "Table Data Chart".
- Fill out the form in accordance with your requirements, given that rows and poles can be added or deleted using embedded tools.
- So far, the chart is columnar, so you have to go to a change in its type.
- In a new window, select the "Circular" option and familiarize yourself with the available varieties.
- Now you see that the circular diagram is compiled correctly and correctly displays the information specified in the table.
- Do not forget to save changes in the project before going out.


Method 4: Online Services
Online services are the same solutions to work with spreadsheets, but directly in the browser, without the need to load additional software.Google Tables
Google Tables are a free tool from a well-known company that allows you to manage your projects on the network and save them in the cloud. This service provides both a function for creating a circular chart, and you can use it like this:
Go to Google Table Online Service
- Press the line above and log in to your Google account to start working with tables. If you don't have a profile, spend a couple of minutes of my time to create it, reading the instructions on the link below.
Excel online
Microsoft made lightweight online versions of its popular programs and allows you to use them for free directly in the browser. Therefore, we propose to try Excel online to find out what the different service is different from the previous one and how to create a circular diagram in it.
Go to Excel online service online
- Use the link above, create an account for Microsoft or log in in an existing one.
- After downloading Office, select the option "New Empty Book".
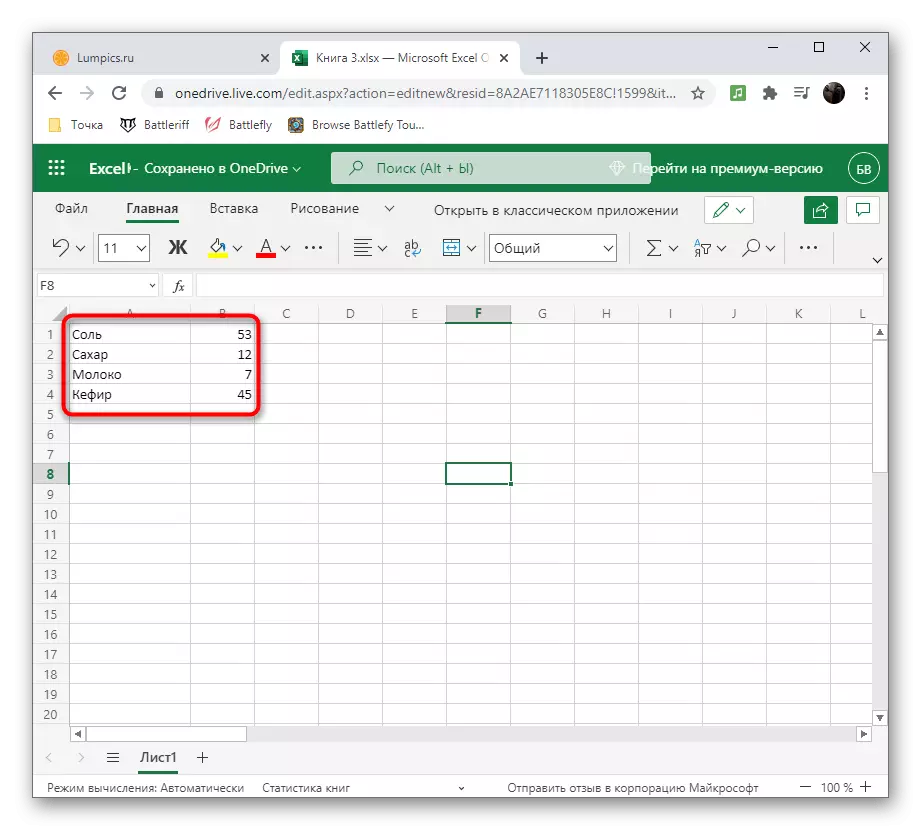
- On the empty sheet, fill the cells for the table around which the circular chart will be built.
- Highlight the data range and click the Insert button.
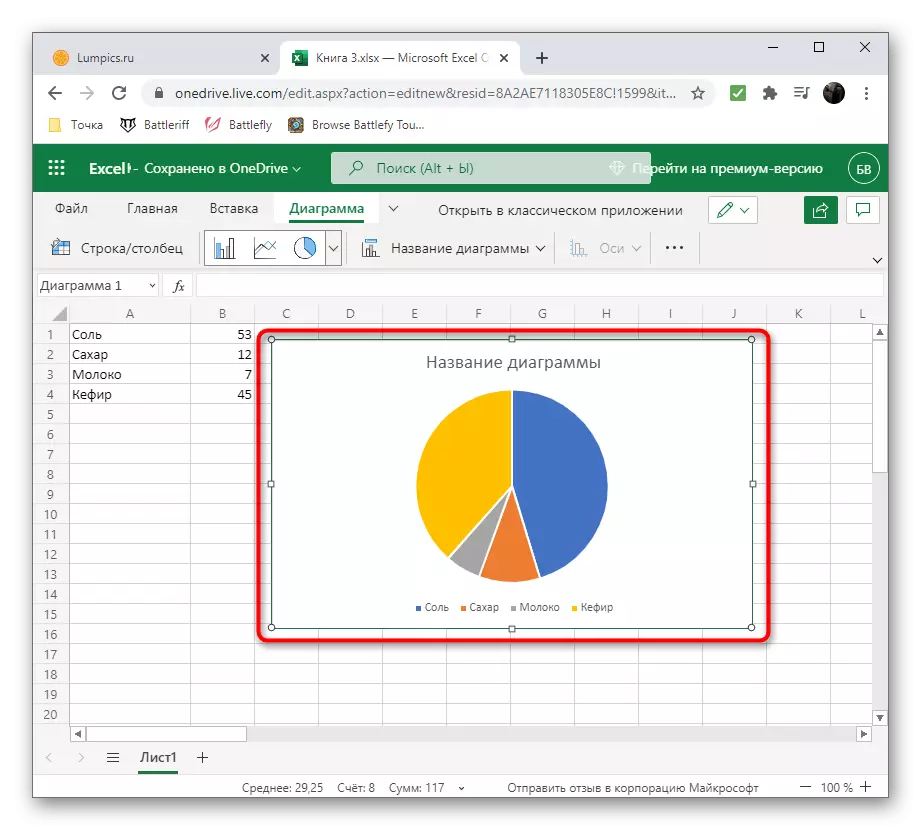
- Use small miniatures to find the circular diagram among them and add it to the sheet.
- Set the name for it and change other parameters depending on personal needs.