

Yandex Browser can be used not only as a web browser, but also as a tool for creating web pages. Development tools exist in every Web browser, including those discussed in us at the moment. Using these tools, users can watch Codes HTML-pages, to monitor the implementation of the actions, and track logs to find errors in running scripts.
How to open the Developer Tools in Yandex Browser
If you need to open the console to perform any of the steps above, then follow our instructions.
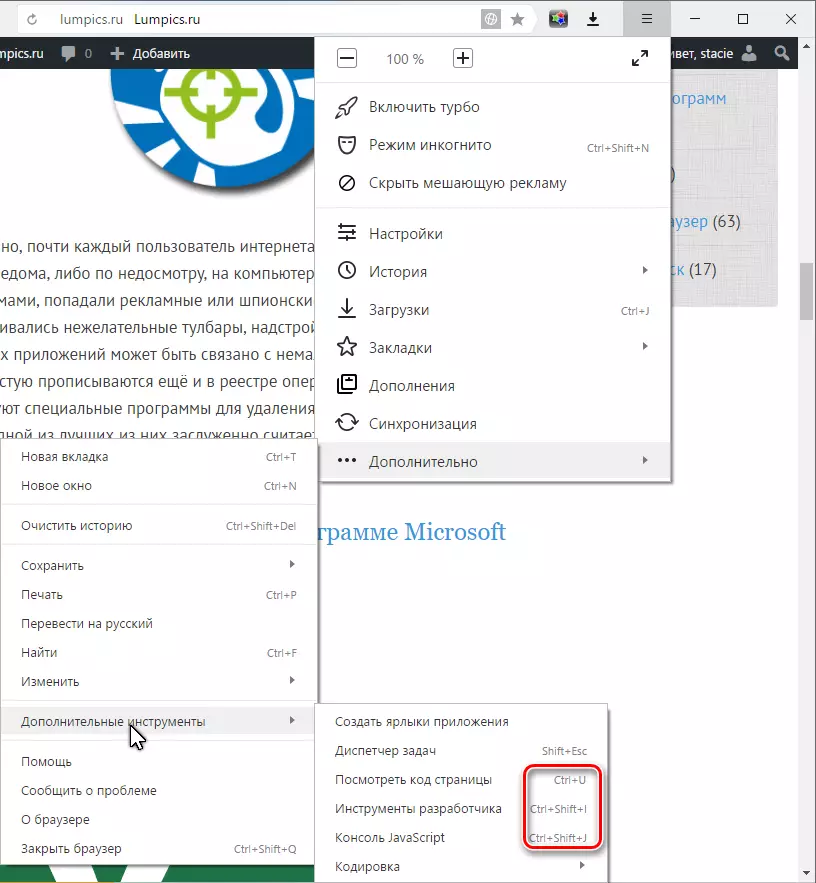
Open the menu and select "Advanced" in the list that appears, select the "Advanced Tools" and then one of the three points:
- "View page source";
- "Developer Tools";
- "Console JavaScript».

All three tools are hot keys for quick access to:
- View Page Source - Ctrl + U;
- Developer Tools - Ctrl + Shift + I;
- JavaScript Console - Ctrl + Shift + J.
Hotkeys work in any keyboard layout and enabled CapsLock.
To open the console, you can choose "Console JavaScript», and then open the developer tools on «Console» tab:
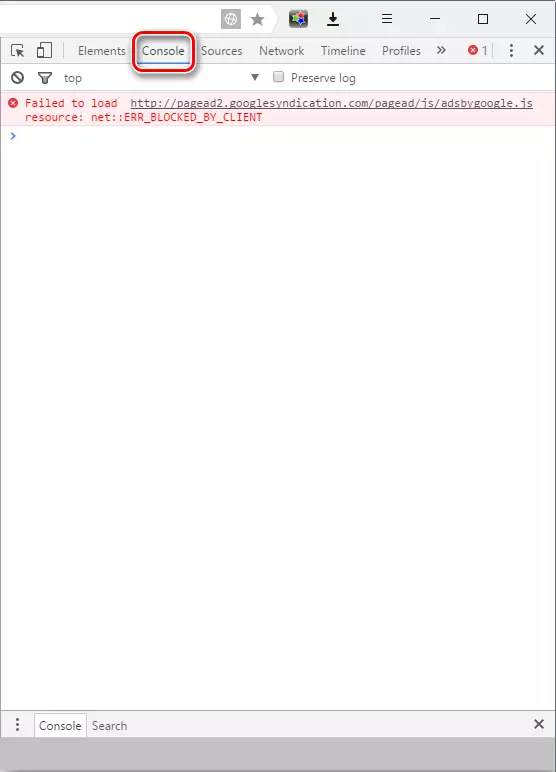
Similarly, you can access the console by opening the menu web browser "Developer Tools" and to manually switch to the tab "Console".
You can also open the "Developer Tools", clicking on the F12 key. This method is universal for many browsers. In this case, again, will have to switch to the tab «Console» manually.
Such an easy way to launch the console will significantly reduce your time and help you focus on creating and editing web pages.