

The Excel program is not just a tabular editor, but also a powerful tool for various mathematical and statistical calculations. The appendix has a huge number of functions intended for these tasks. True, not all these features are activated by default. It is that such hidden functions includes a set of data analysis tools. Let's find out how it can be turned on.
Turning on the tool block
To take advantage of the features that the "Data Analysis" feature, you need to activate the "Analysis Package" tool group by performing certain actions in Microsoft Excel settings. The algorithm of these actions is almost the same for versions of the 2010, 2013 and 2016 program, and has only minor differences in the 2007 version.Activation
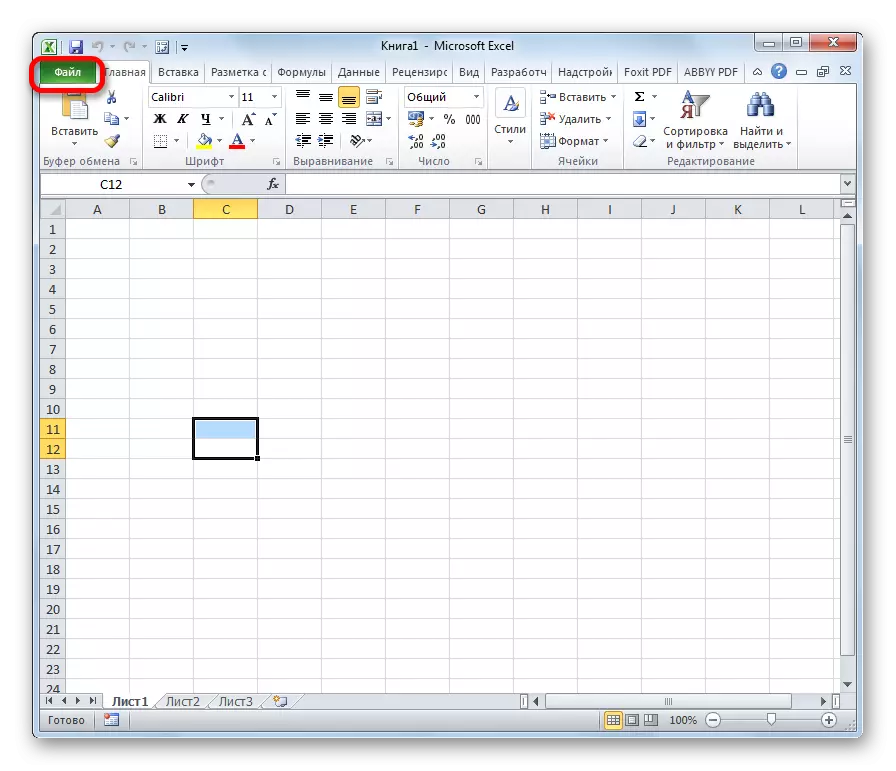
- Go to the "File" tab. If you are using the version of Microsoft Excel 2007, then instead of the File button, click the Microsoft Office icon in the upper left corner of the window.
- Click on one of the items presented in the left side of the window that opened is "Parameters".
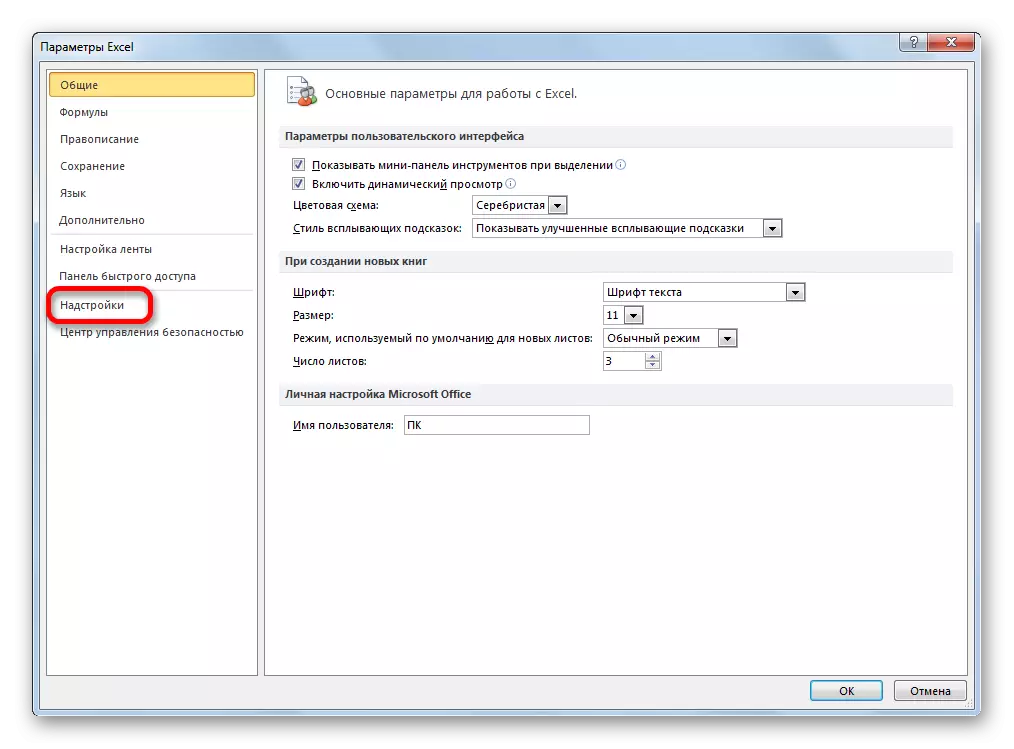
- In the opened window of the Excel parameters, go to the "Add-in" subsection (the penultimate in the list on the left side of the screen).
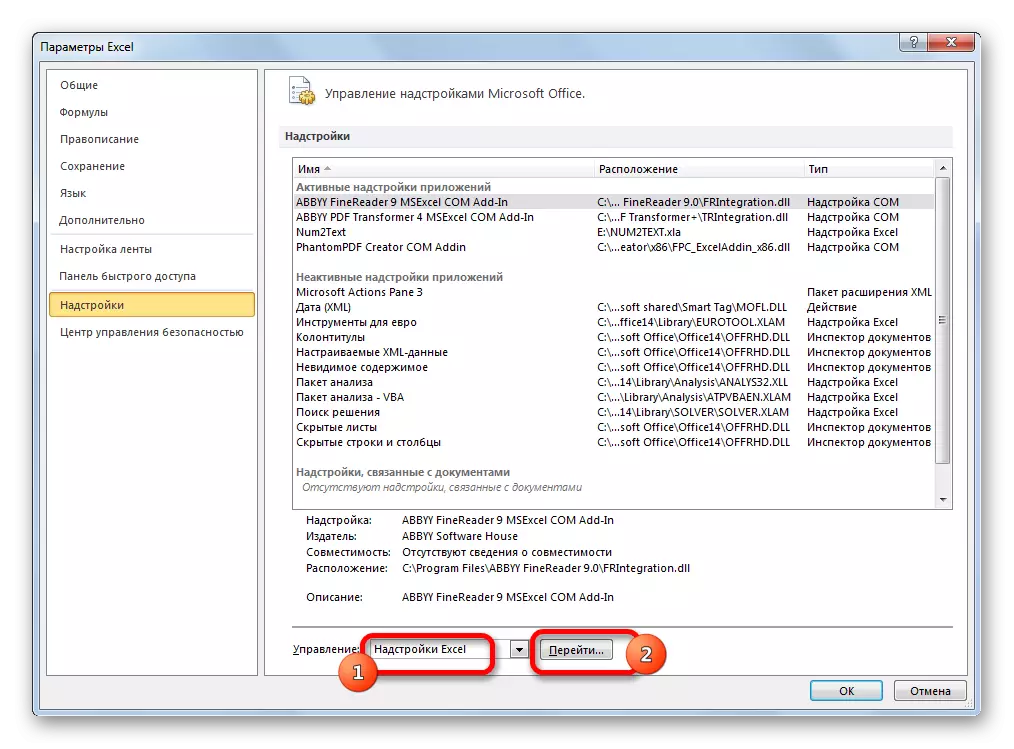
- In this subsection, we will be interested in the lower part of the window. There is a "Management" parameter. If in the drop-down form relating to it, it is worth a value other than the "Excel add-engine", then you need to change it to the specified one. If this item is installed, I just click on the "Go ..." button to the right of it.
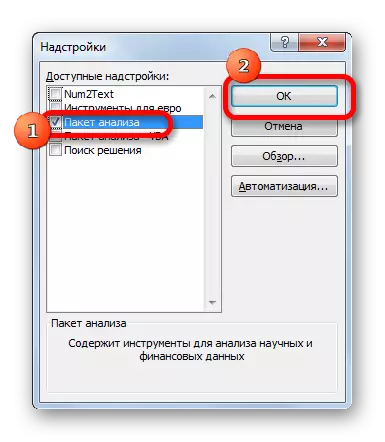
- A small window of the available superstructure opens. Among them, you need to choose the item "Package of Analysis" and put a tick about it. After that, click on the "OK" button located at the very top of the right side of the window.

After performing these actions, the specified function will be activated, and its toolkit is available on Excel Ribbon.
Running the Data Analysis Group functions
Now we can run any of the data analysis team tools.
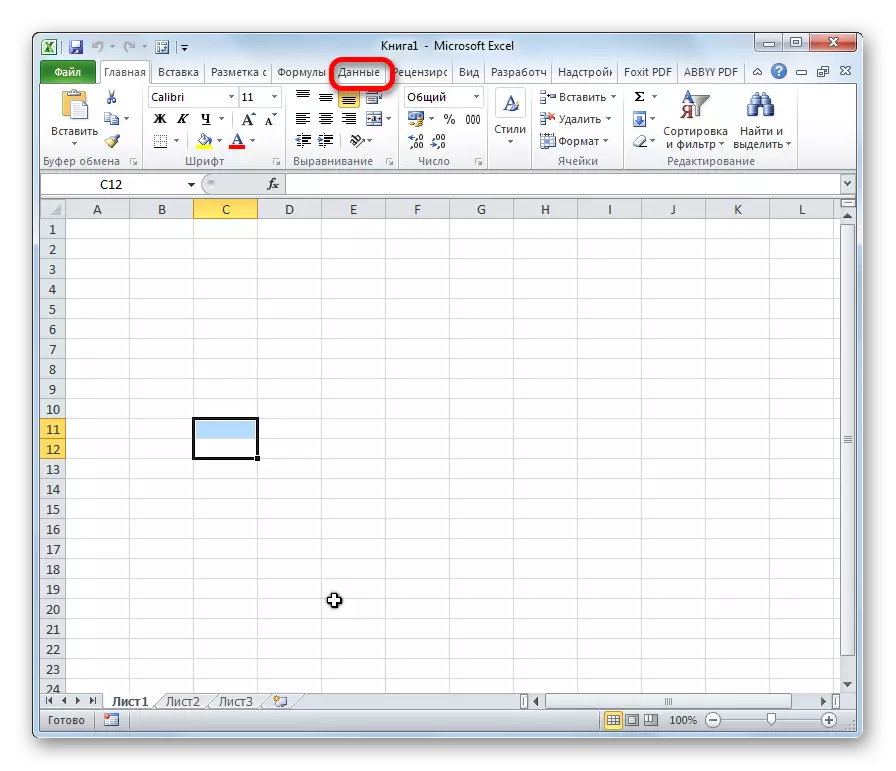
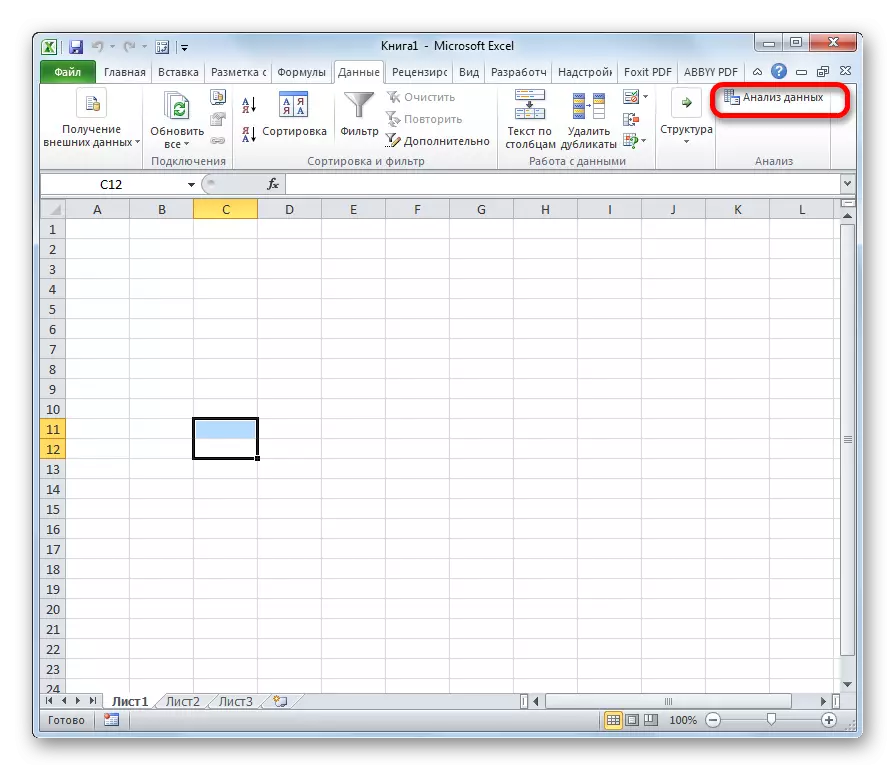
- Go to the "Data" tab.
- In the tab that the ribbon opened on the right edge of the tape is located. Click on the "Data Analysis" button, which is located in it.
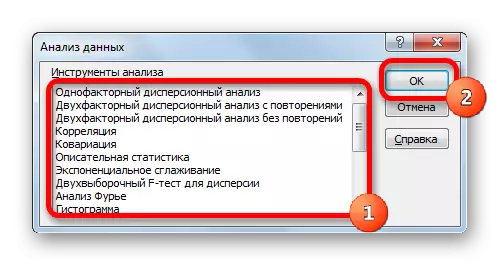
- After that, the window is launched with a large list of various tools that offers the Data Analysis feature. Among them you can highlight the following features:
- Correlation;
- Bar graph;
- Regression;
- Sample;
- Exponential smoothing;
- Random number generator;
- Descriptive statistics;
- Fourier analysis;
- Various types of dispersion analysis, etc.
Select the feature that we want to use and press the "OK" button.
Work in each function has its own algorithm. The use of some instruments of the data analysis group are described in separate lessons.
Lesson: Correlation analysis in Excel
Lesson: Regression analysis in Excel
Lesson: How to make a histogram in Excel
As we see, although the "analysis package" tool block is not activated by default, the process of its inclusion is quite simple. At the same time, without knowing a clear algorithm for action, the user is unlikely to quickly activate this very useful statistical function.